
 Facebook
 X
X
 Pinterest
 Copy Link
Windermere Foundation Update
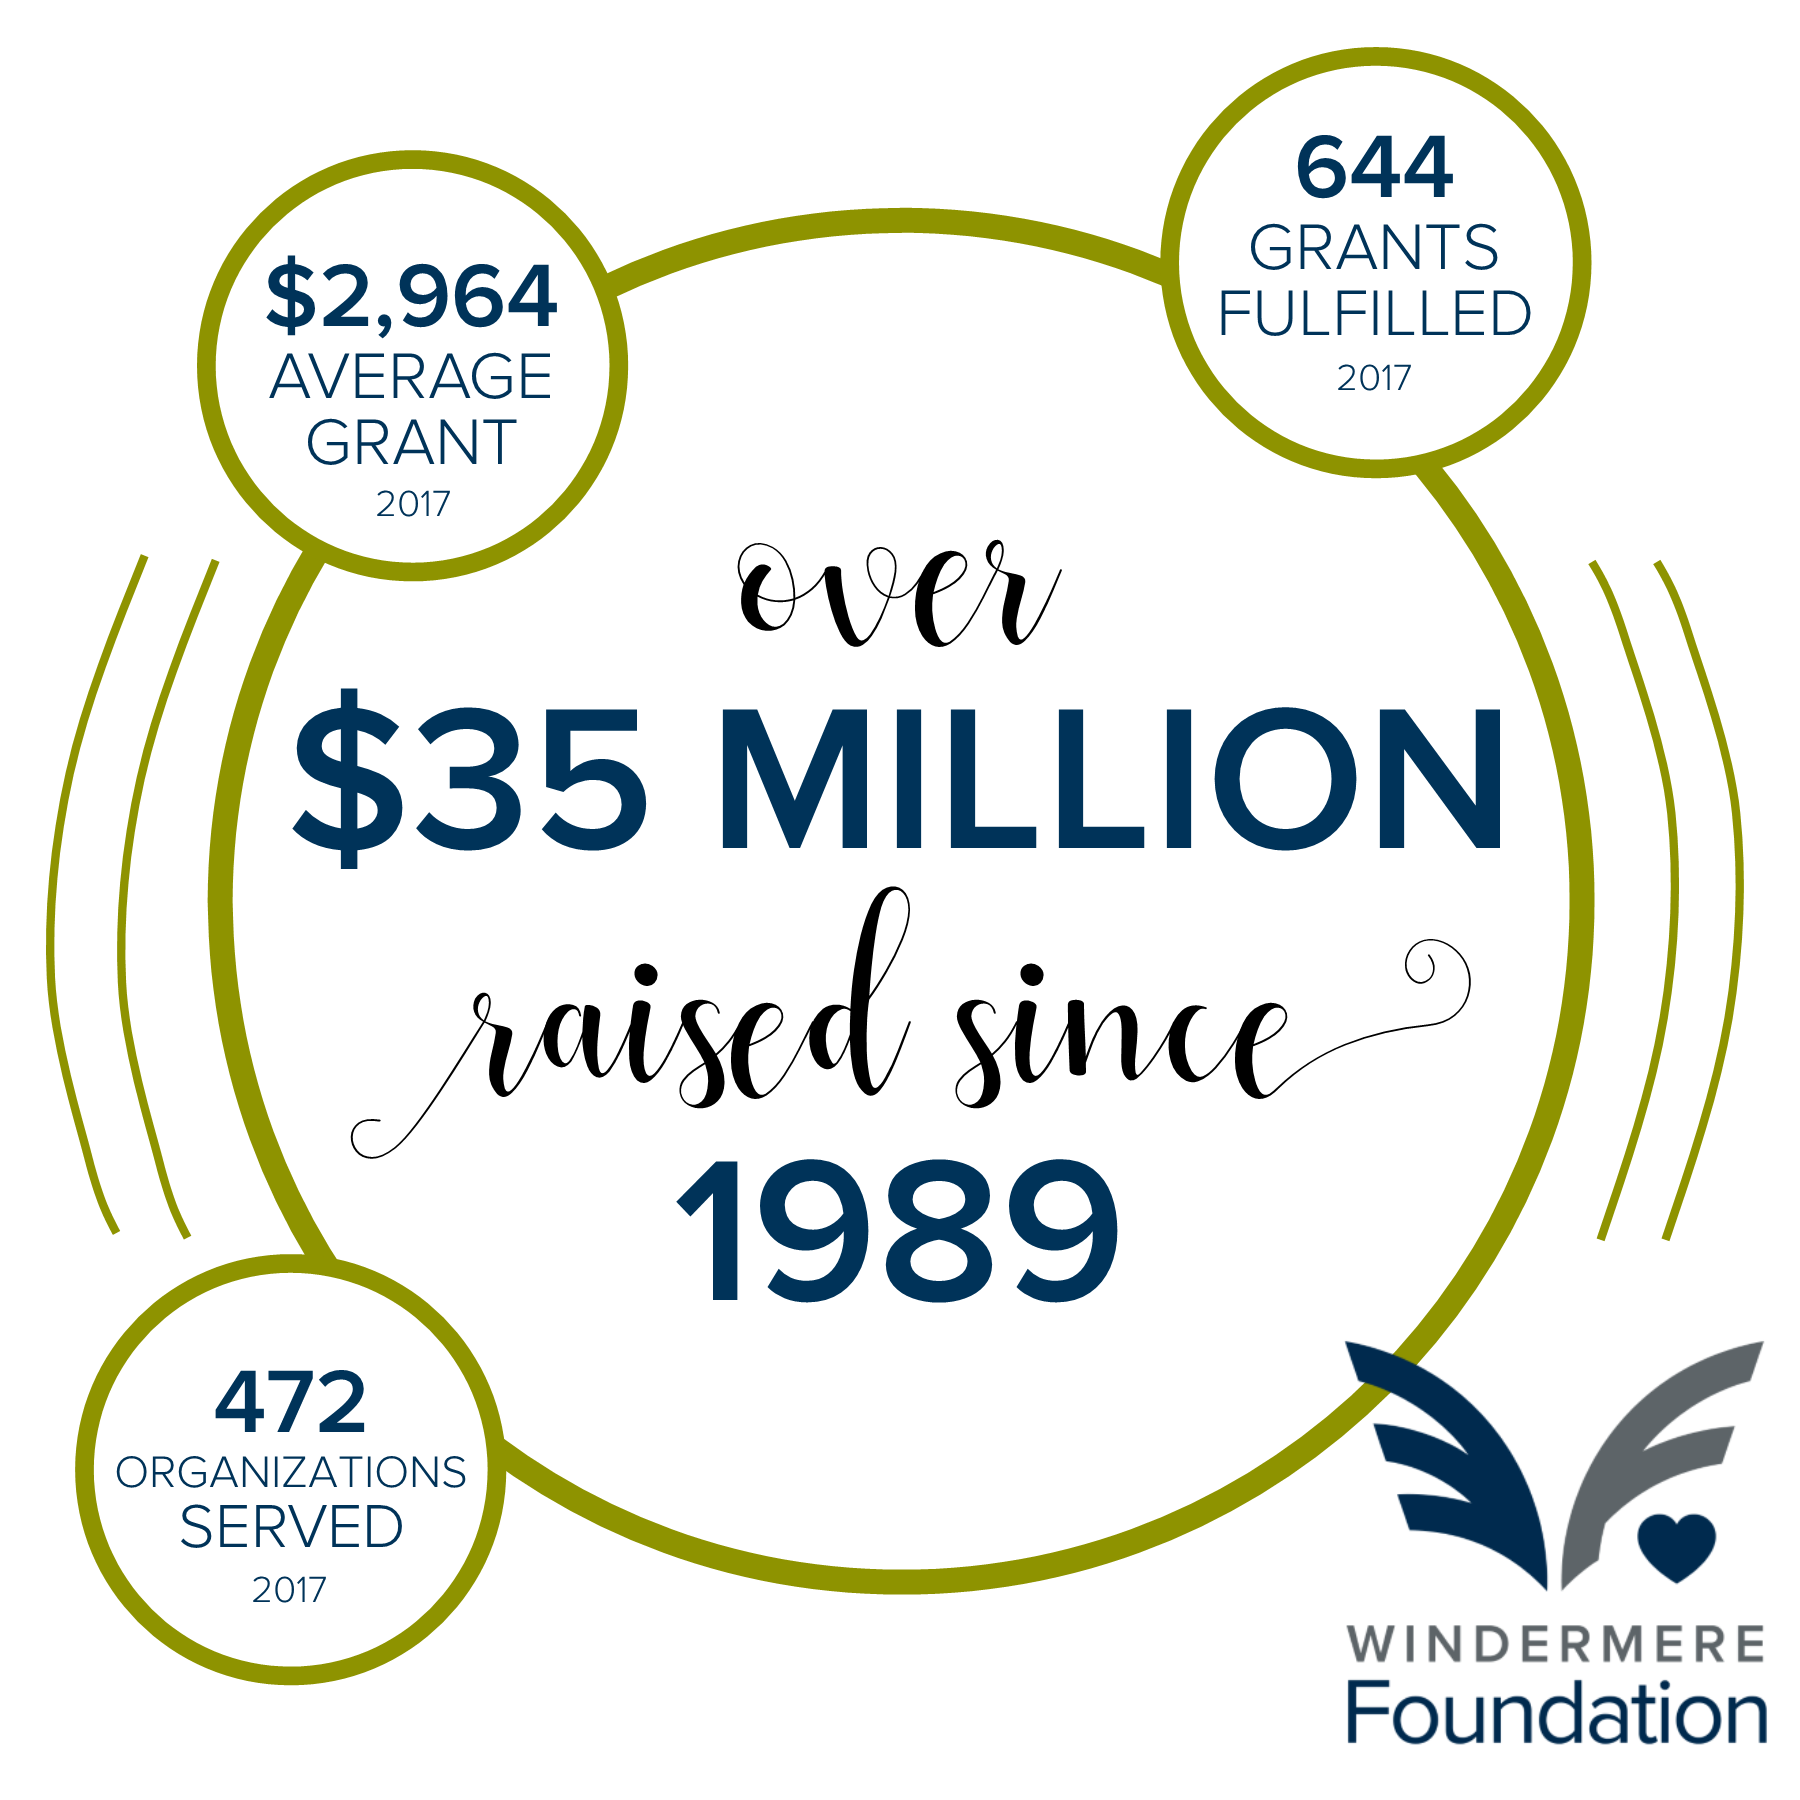

Thanks to your continued support, the Windermere Foundation collected over $330,000 in donations in the first quarter of 2018. Fifty-eight percent of the donations came from individual contributions and fundraisers, while 42 percent came from donations through Windermere agent sales transactions. This brings our grand total to $35,869,961 raised since 1989. We are very close to reaching the $36-million mark! These funds go towards supporting low-income and homeless families right here in our local community.
Thanks again for all you do to support the Windermere Foundation. Together, we are able to make a difference for those in need in our local communities.
For the full first quarter 2018 report, please visit the Windermere blog, and to learn more about the Windermere Foundation, visit www.windermere.com/foundation.
Tax Reform 2018


Now that the 20 17 tax deadline has come and gone it is time to think about how the new tax reform of 2018 might affect you next year. A few notable items are the limited mortgage interest rate deduction capped at $750,000, limited property tax deduction capped at $10,000 and moving expenses can only be written off by members of the armed services. Read the full article here and take notes, so you are prepared for next year’s tax season.

South King County Market Trends – Q1 2018
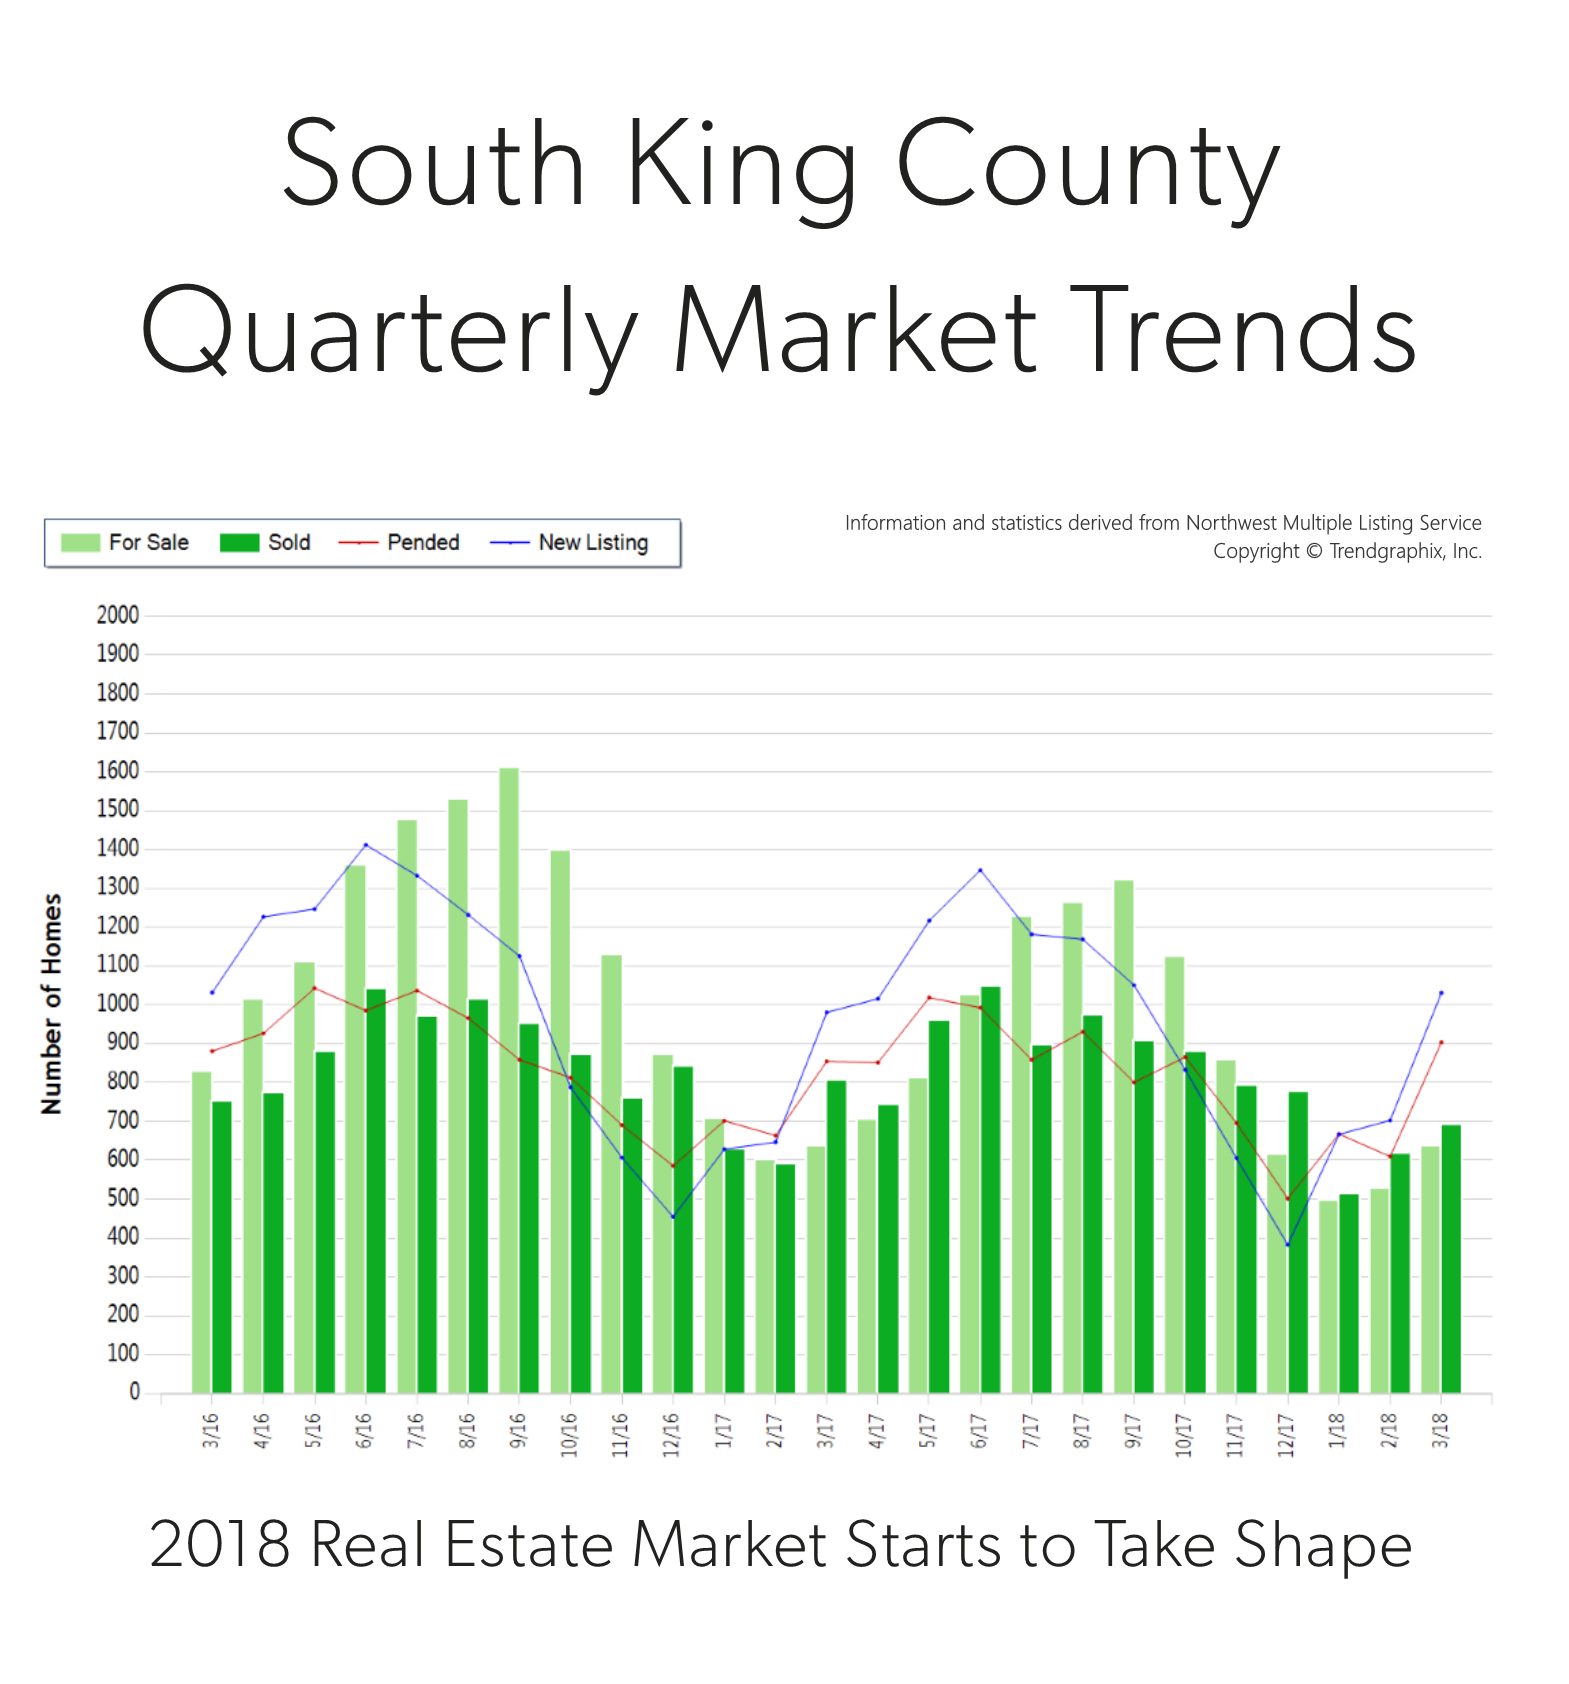

It is the time of year when our market starts to take off. Spring is here and we are starting to see seasonal increases in inventory. In fact, there was a 47% increase in new listings in March compared to February. That increase was matched by a 48% rise in pending sales, illustrating very strong demand for housing in your area. Last month, the average list-to-sale price ratio (the amount the sale price topped the list price) was 101%, indicating that multiple offers were the norm. We ended the quarter with 0.7 months of inventory – the lowest level yet. More inventory would be absorbed by happy buyers looking for more selection and would help temper price growth, which is up 12% year-over-year.
South King County real estate has been a hot spot due to reasonable commute times and overall affordability compared to “in-city” real estate. In fact, the median price in March was 78% higher in Seattle Metro. Sellers are enjoying amazing returns due to this phenomenon, and buyers are securing mortgages with minor debt service due to low interest rates. This is a very strong seller’s market, but buyers who are securing a home are already enjoying appreciation in equity.
This is only a snapshot of the trends in south King County; please contact me if you would like further explanation of how the latest trends relate to you.
Eastside Quarterly Market Trends – Q1 2018
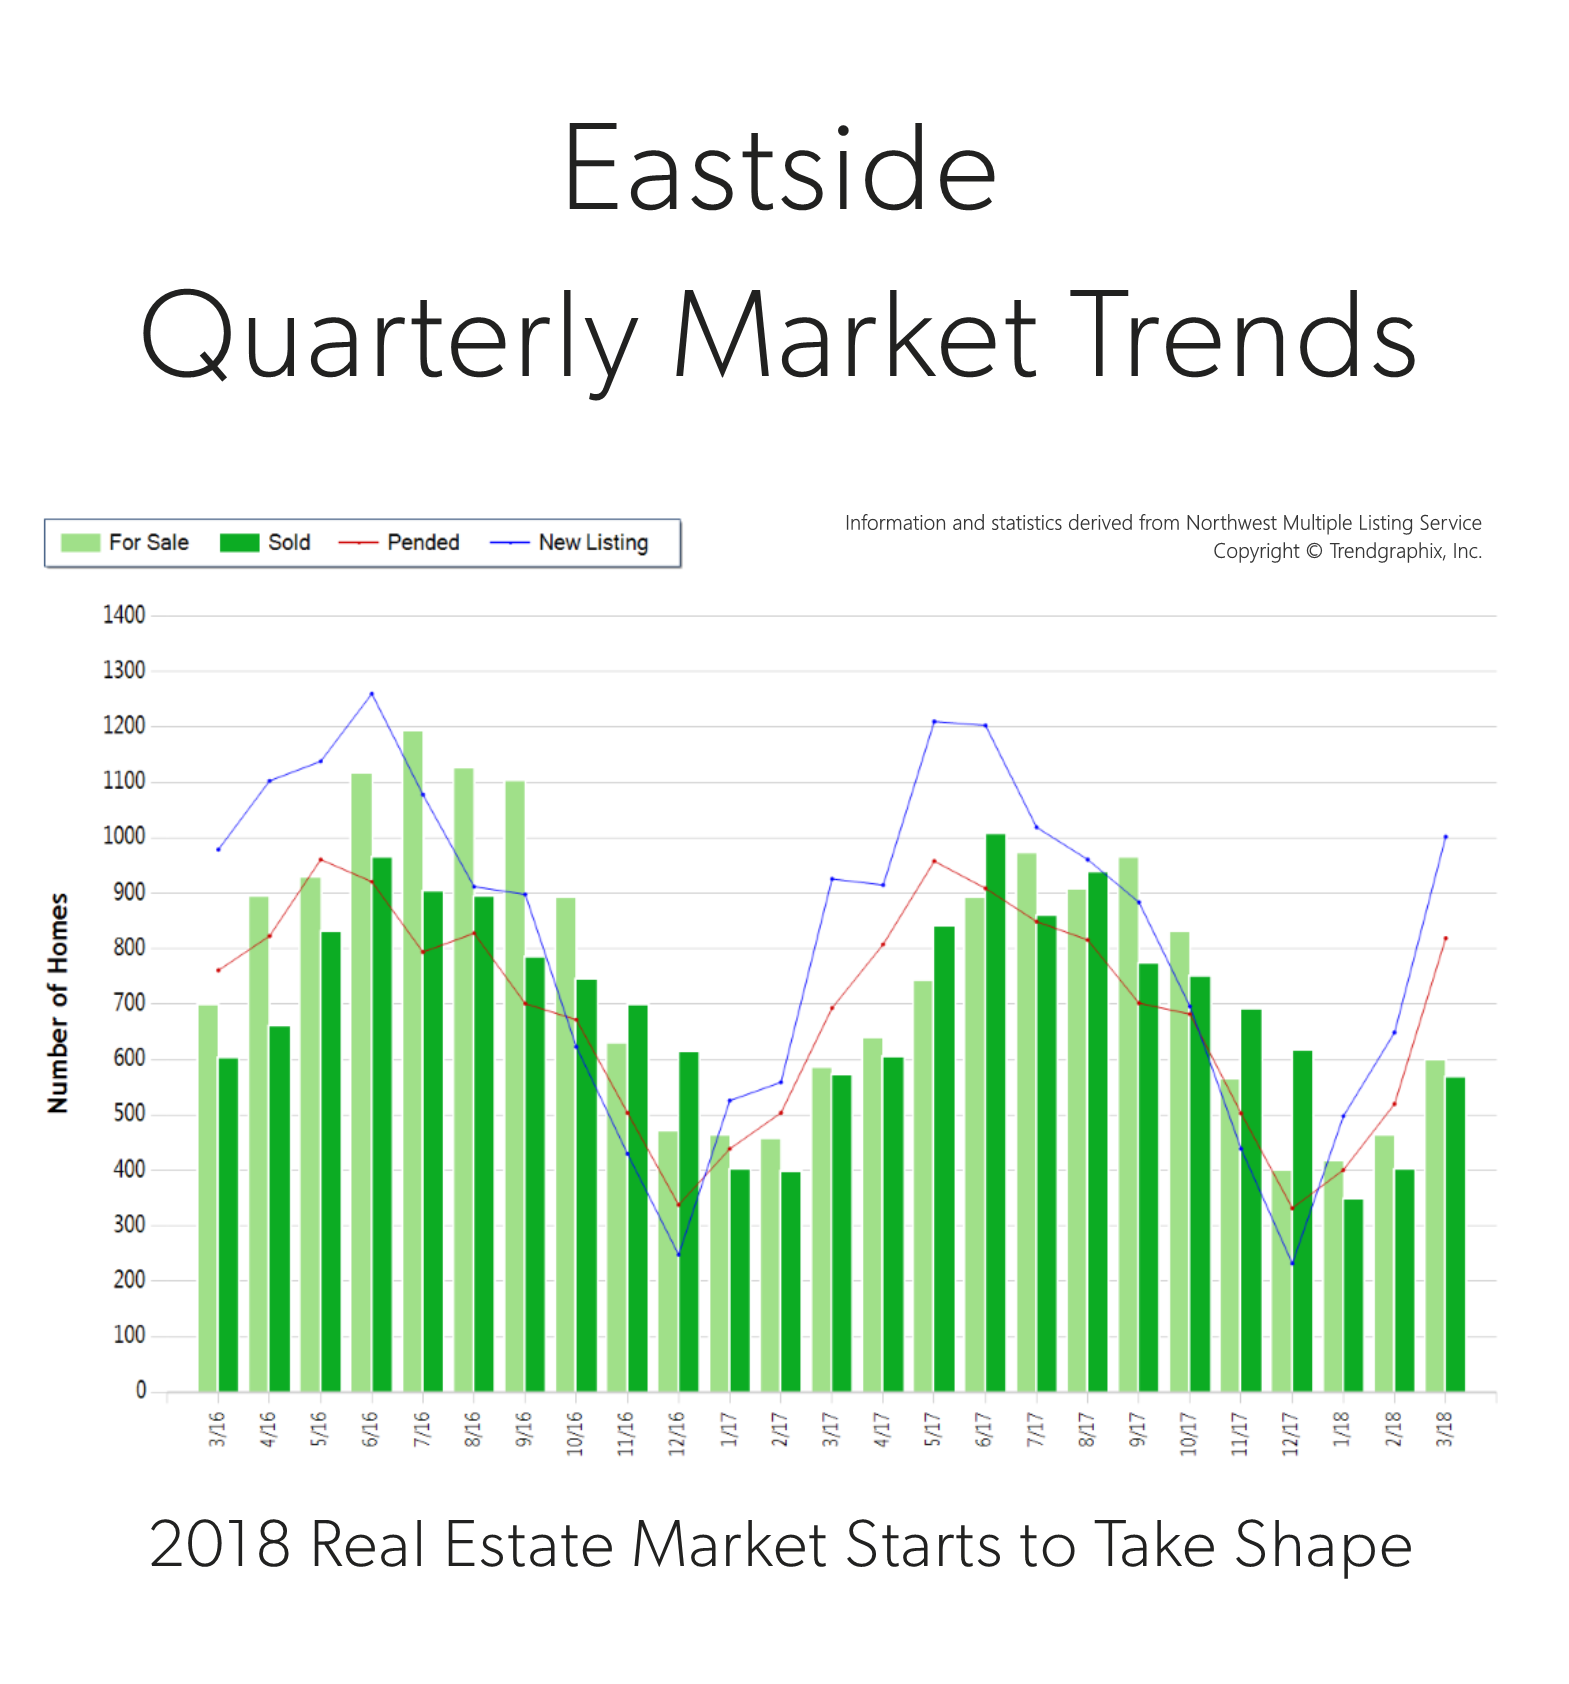

It is the time of year when our market starts to take off. Spring is here and we are starting to see seasonal increases in inventory. In fact, there was a 54% increase in new listings in March compared to February. That increase was topped by a 58% rise in pending sales, illustrating very strong demand for housing in your area. Last month, the average list-to-sale price ratio (the amount the sale price topped the list price) was 103%, indicating that multiple offers were the norm. We ended the quarter with 0.7 months of inventory – the lowest level yet. More inventory would be absorbed by happy buyers looking for more selection and would help temper price growth, which is up 14% year-over-year.
Eastside real estate has a very high premium due to close-in commute times and desirable neighborhoods. In fact, the median price in March was $927,000! Sellers are enjoying amazing returns due to this phenomenon, and buyers are securing mortgages with minor debt service due to low interest rates. This is a very strong seller’s market, but buyers who are securing a home are already enjoying appreciation in equity.
This is only a snapshot of the trends on the Eastside area; please contact me if you would like further explanation of how the latest trends relate to you.
Seattle Metro Quarterly Market Trends – Q1 2018
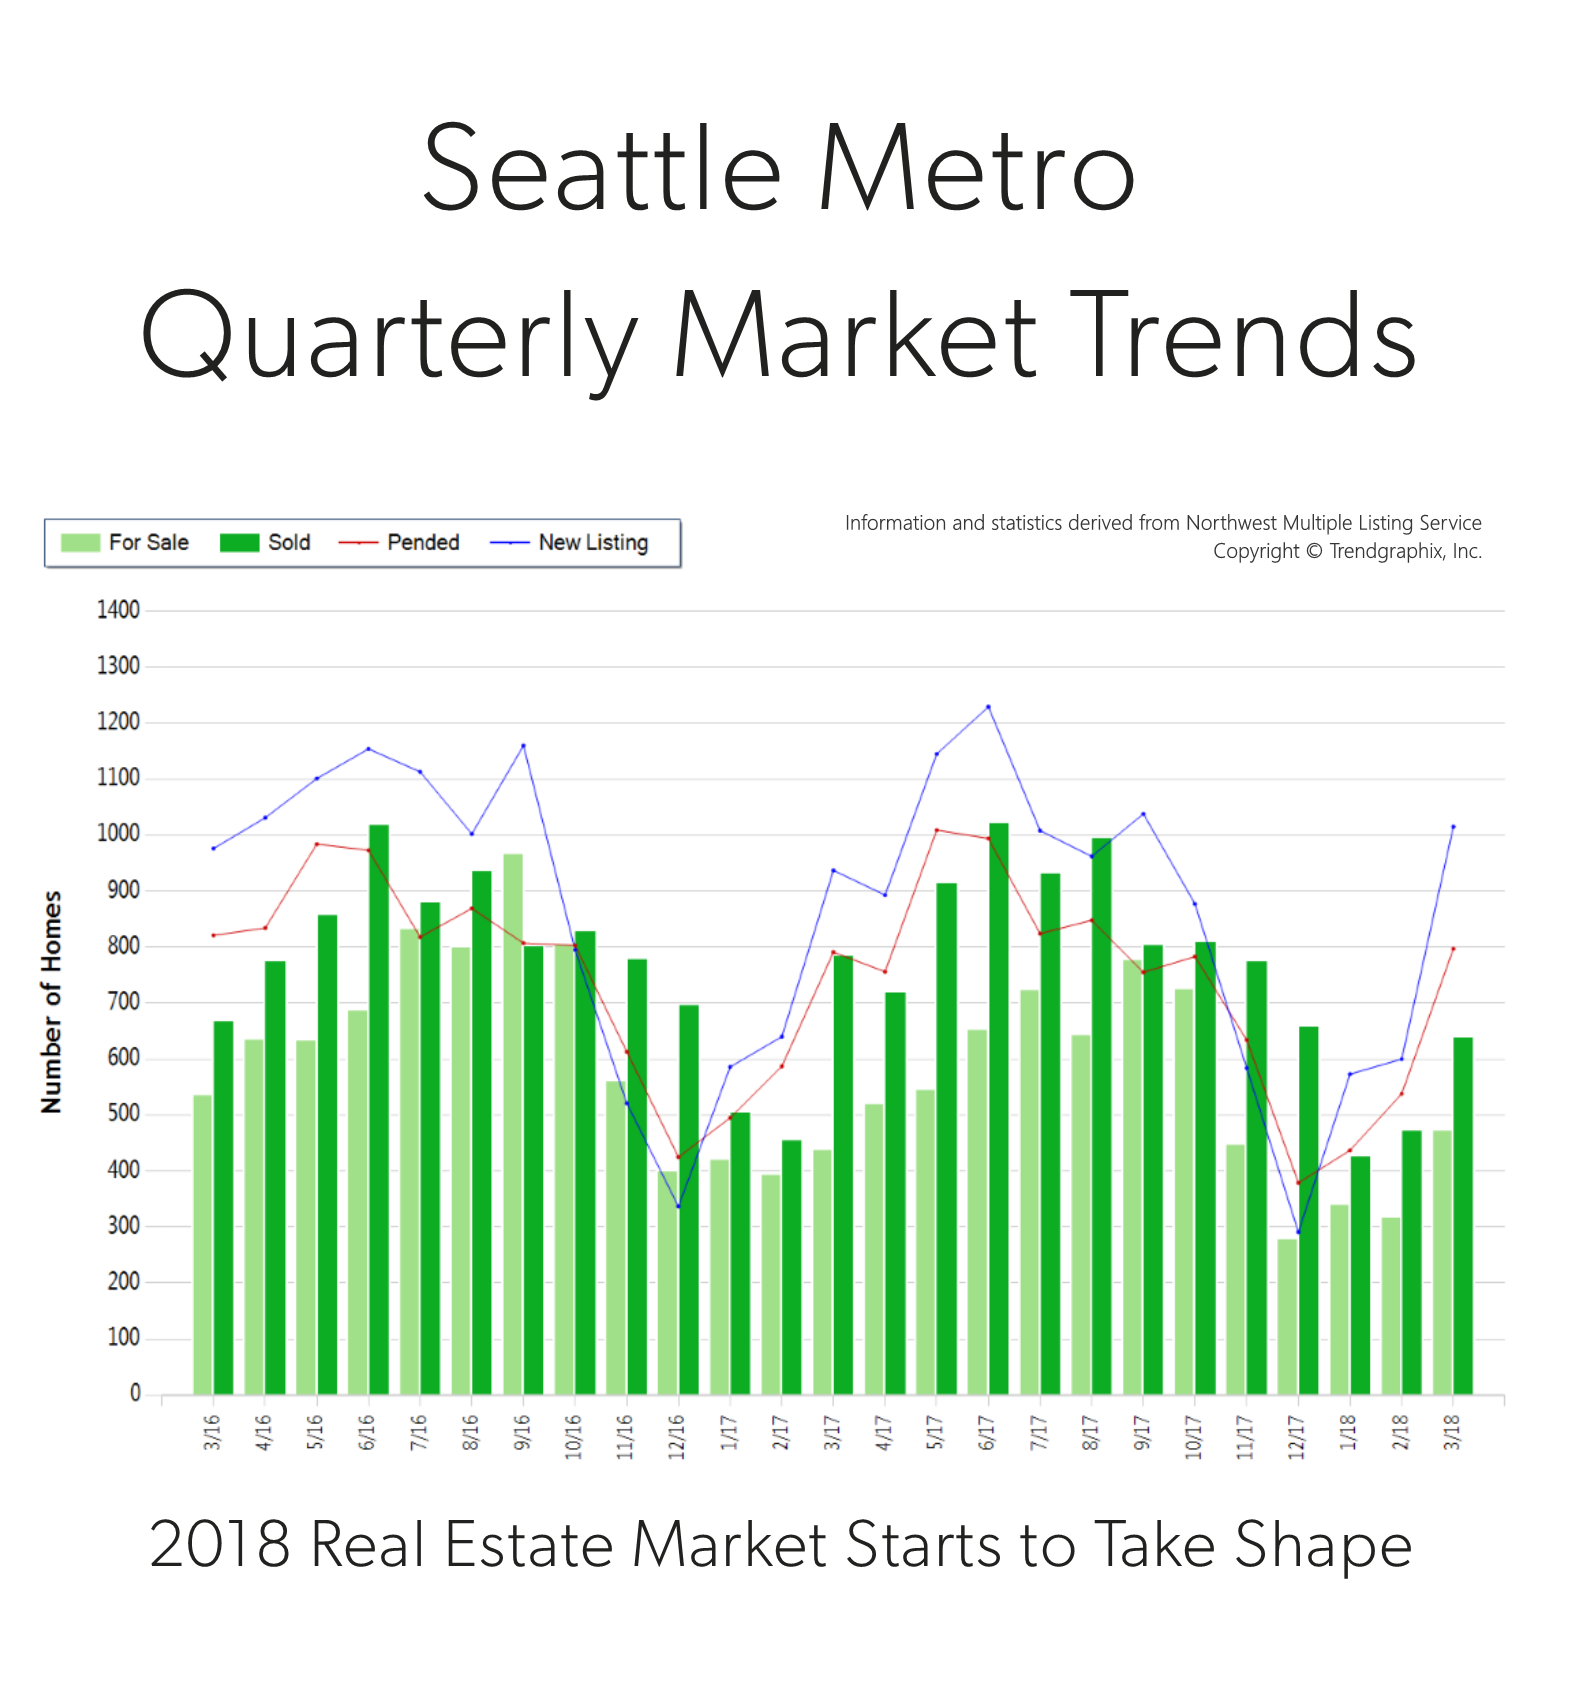

It is the time of year when our market starts to take off. Spring is here and we are starting to see seasonal increases in inventory. In fact, there was a 69% increase in new listings in March compared to February. That increase was followed by a 48% rise in pending sales, illustrating very strong demand for housing in your area. Last month, the average list-to-sale price ratio (the amount the sale price topped the list price) was 105%, indicating that multiple offers were the norm. We ended the quarter with 0.6 months of inventory based on pending sales. More inventory would be absorbed by happy buyers looking for more selection and would help temper price growth, which is up 16% year-over-year.
Seattle Metro real estate has a very high premium due to close-in commute times and vibrant neighborhoods. In fact, the median price in March was $800,000, up 5% from the month prior! Sellers are enjoying amazing returns due to this phenomenon, and buyers are securing mortgages with minor debt service due to low interest rates. This is a very strong seller’s market, but buyers who are securing a home are already enjoying appreciation in equity.
This is only a snapshot of the trends in the Seattle Metro area; please contact me if you would like further explanation of how the latest trends relate to you.
North King County Quarterly Market Trends – Q1 2018
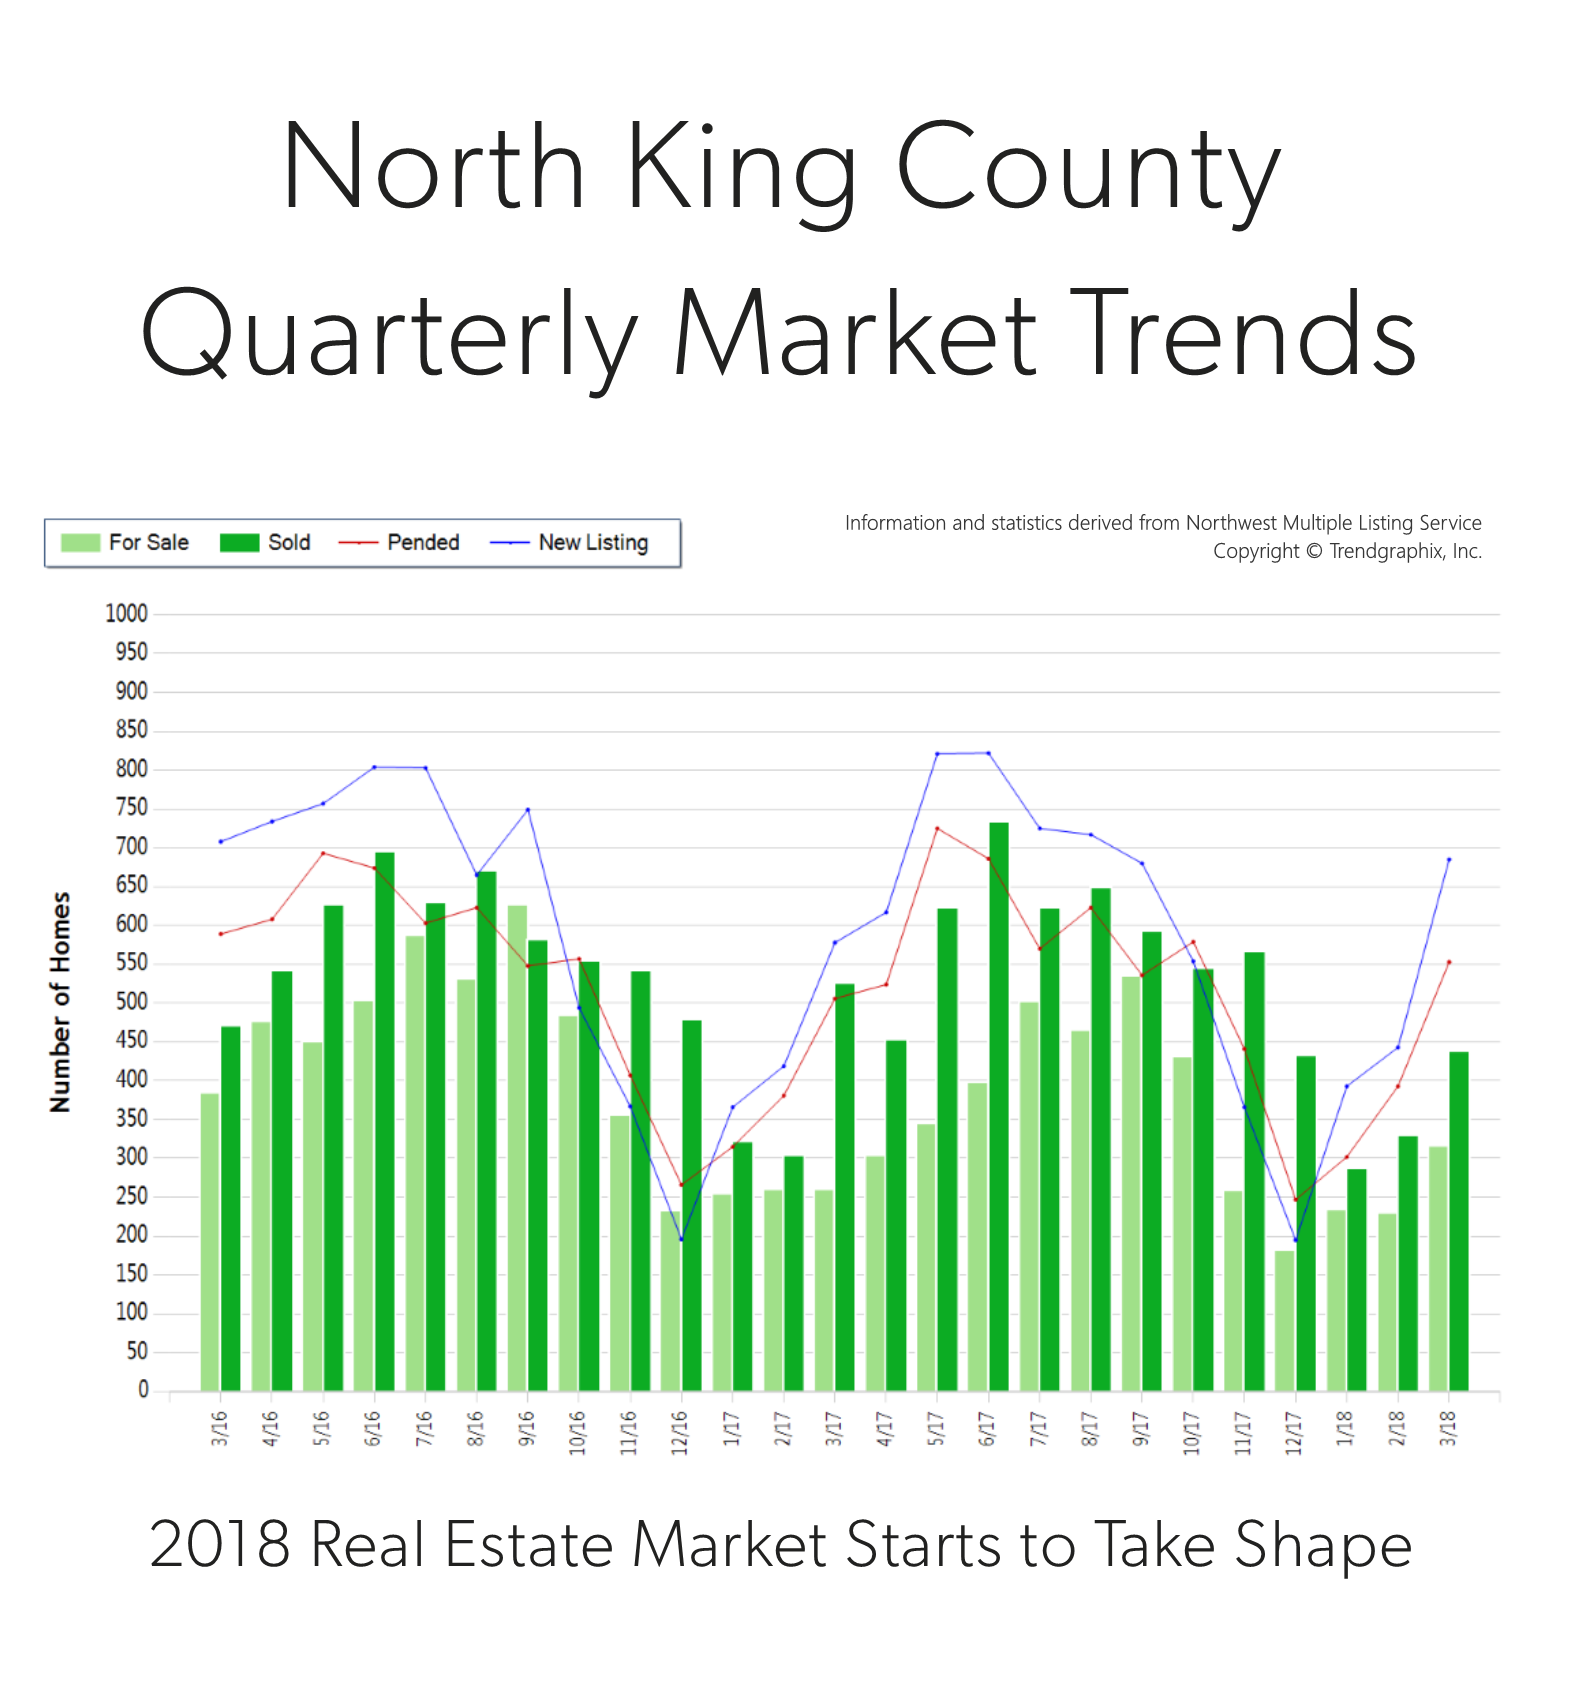

It is the time of year when our market starts to take off. Spring is here and we are starting to see seasonal increases in inventory. In fact, there was a 55% increase in new listings in March compared to February. That increase was followed by a 41% rise in pending sales, illustrating very strong demand for housing in your area. Last month, the average list-to-sale price ratio (the amount the sale price topped the list price) was 106%, indicating that multiple offers were the norm. We ended the quarter with 0.6 months of inventory based on pending sales. More inventory would be absorbed by happy buyers looking for more selection and would help temper price growth, which is up 14% year-over-year.
North King County real estate has a very high premium due to close-in commute times and desirable neighborhoods. In fact, the median price in March was $808,000, up 4% from the month prior! Sellers are enjoying amazing returns due to this phenomenon, and buyers are securing mortgages with minor debt service due to low interest rates. This is a very strong seller’s market, but buyers who are securing a home are already enjoying appreciation in equity.
South Snohomish County Quarterly Market Trends – Q1 2018
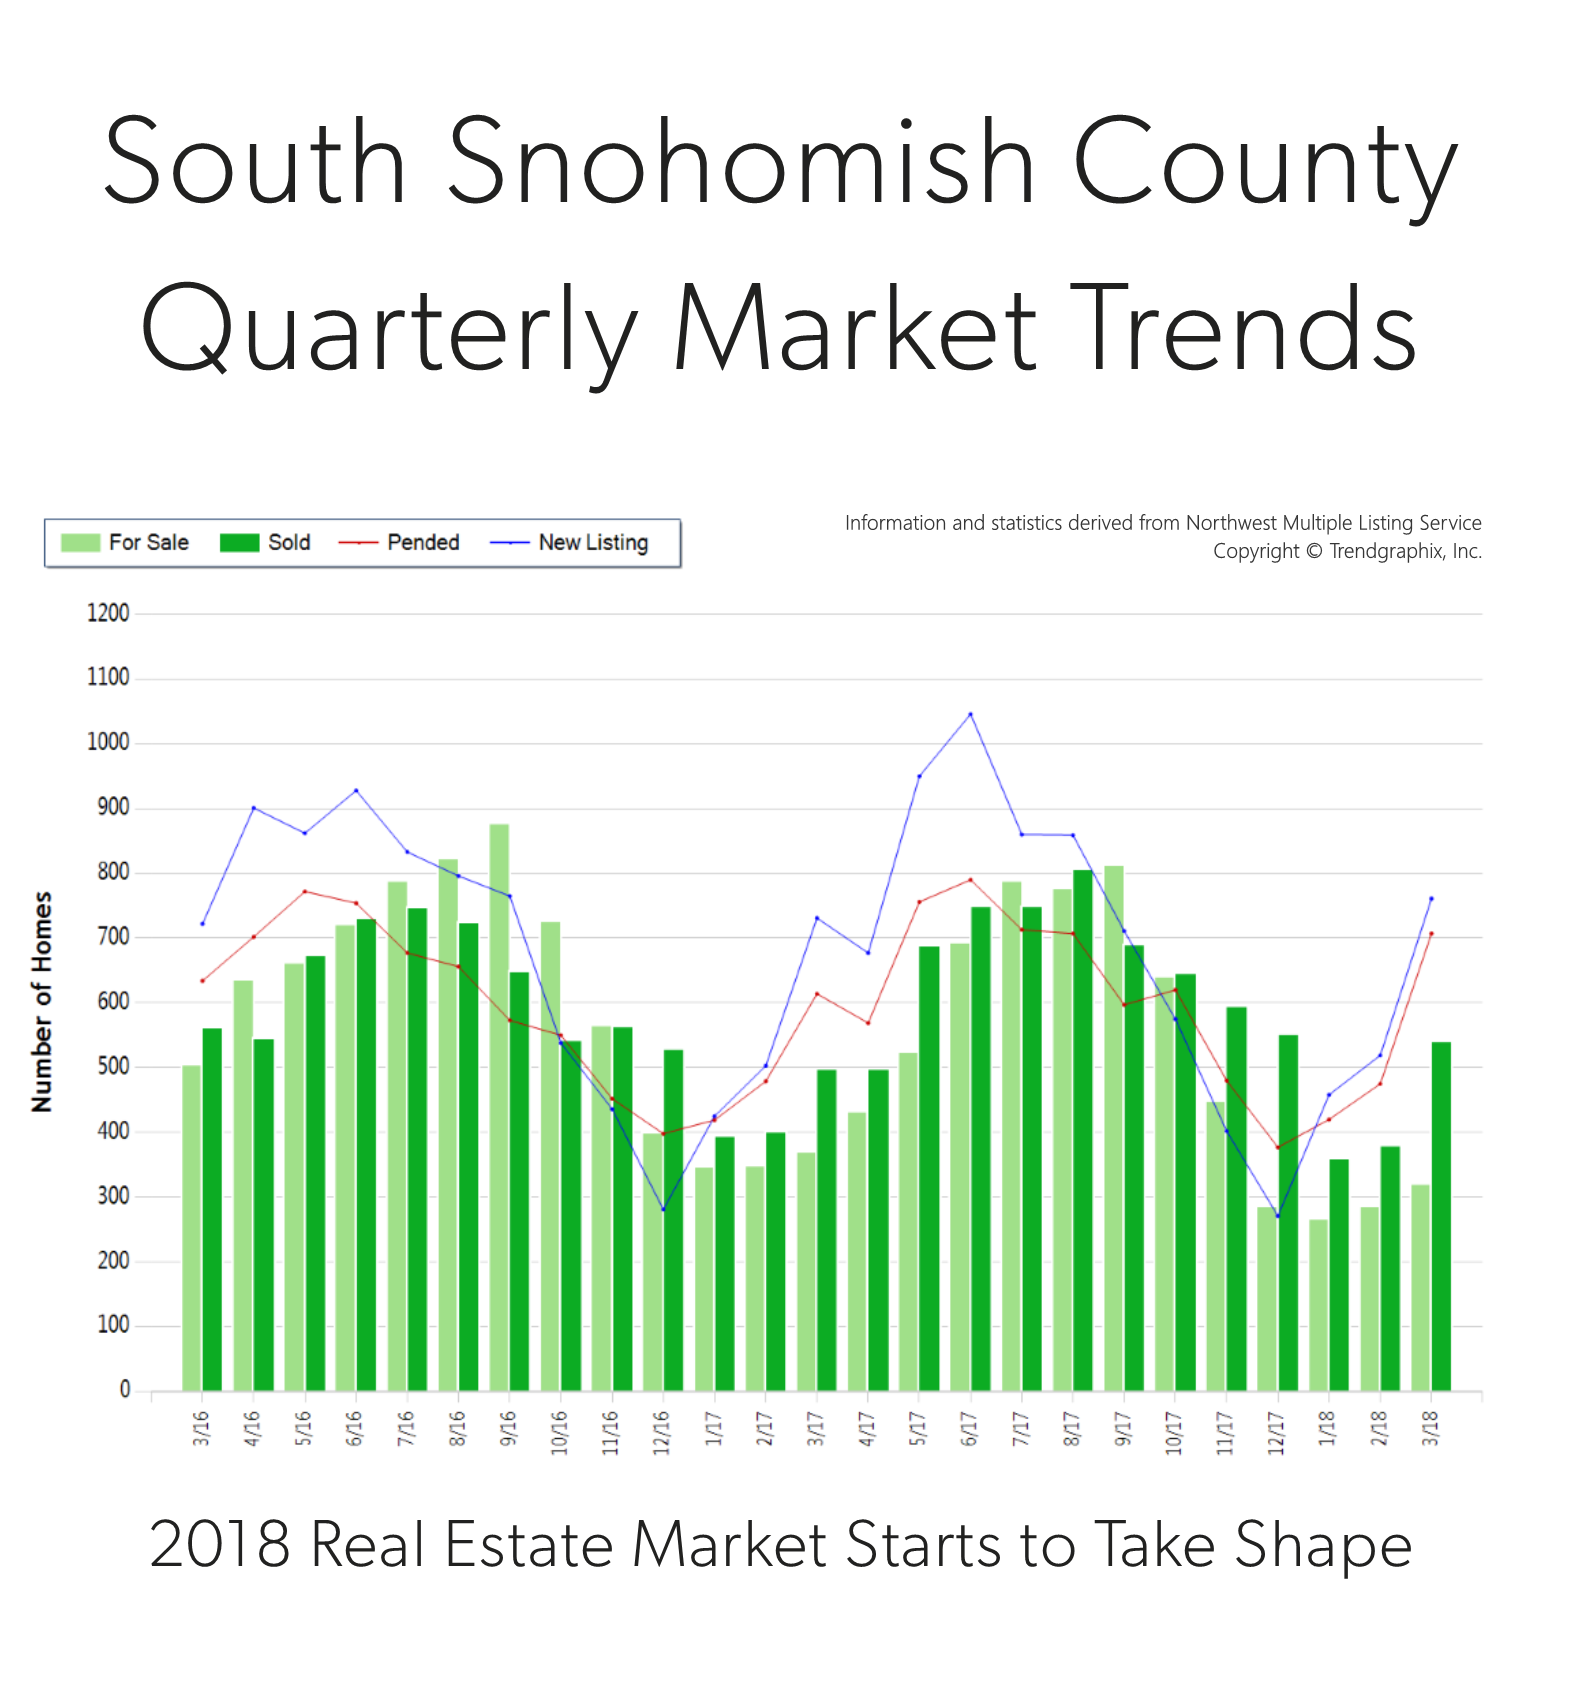

It is the time of year when our market starts to take off. Spring is here and we are starting to see seasonal increases in inventory. In fact, there was a 47% increase in new listings in March compared to February. That increase was matched by a 48% rise in pending sales, illustrating very strong demand for housing in your area. Last month, the average list-to-sale price ratio (the amount the sale price topped the list price) was 103%, indicating that multiple offers were the norm. We ended the quarter with 0.5 months of inventory – the lowest level yet. More inventory would be absorbed by happy buyers looking for more selection and would help temper price growth, which is up 15% year-over-year.
South Snohomish County real estate has been a hot spot due to reasonable commute times and overall affordability compared to “in-city” real estate. In fact, the median price in March was 47% higher in Seattle Metro. Sellers are enjoying amazing returns due to this phenomenon, and buyers are securing mortgages with minor debt service due to low interest rates. This is a very strong seller’s market, but buyers who are securing a home are already enjoying appreciation in equity.
This is only a snapshot of the trends in south Snohomish County; please contact me if you would like further explanation of how the latest trends relate to you.
North Snohomish County Quarterly Market Trends – Q1 2018
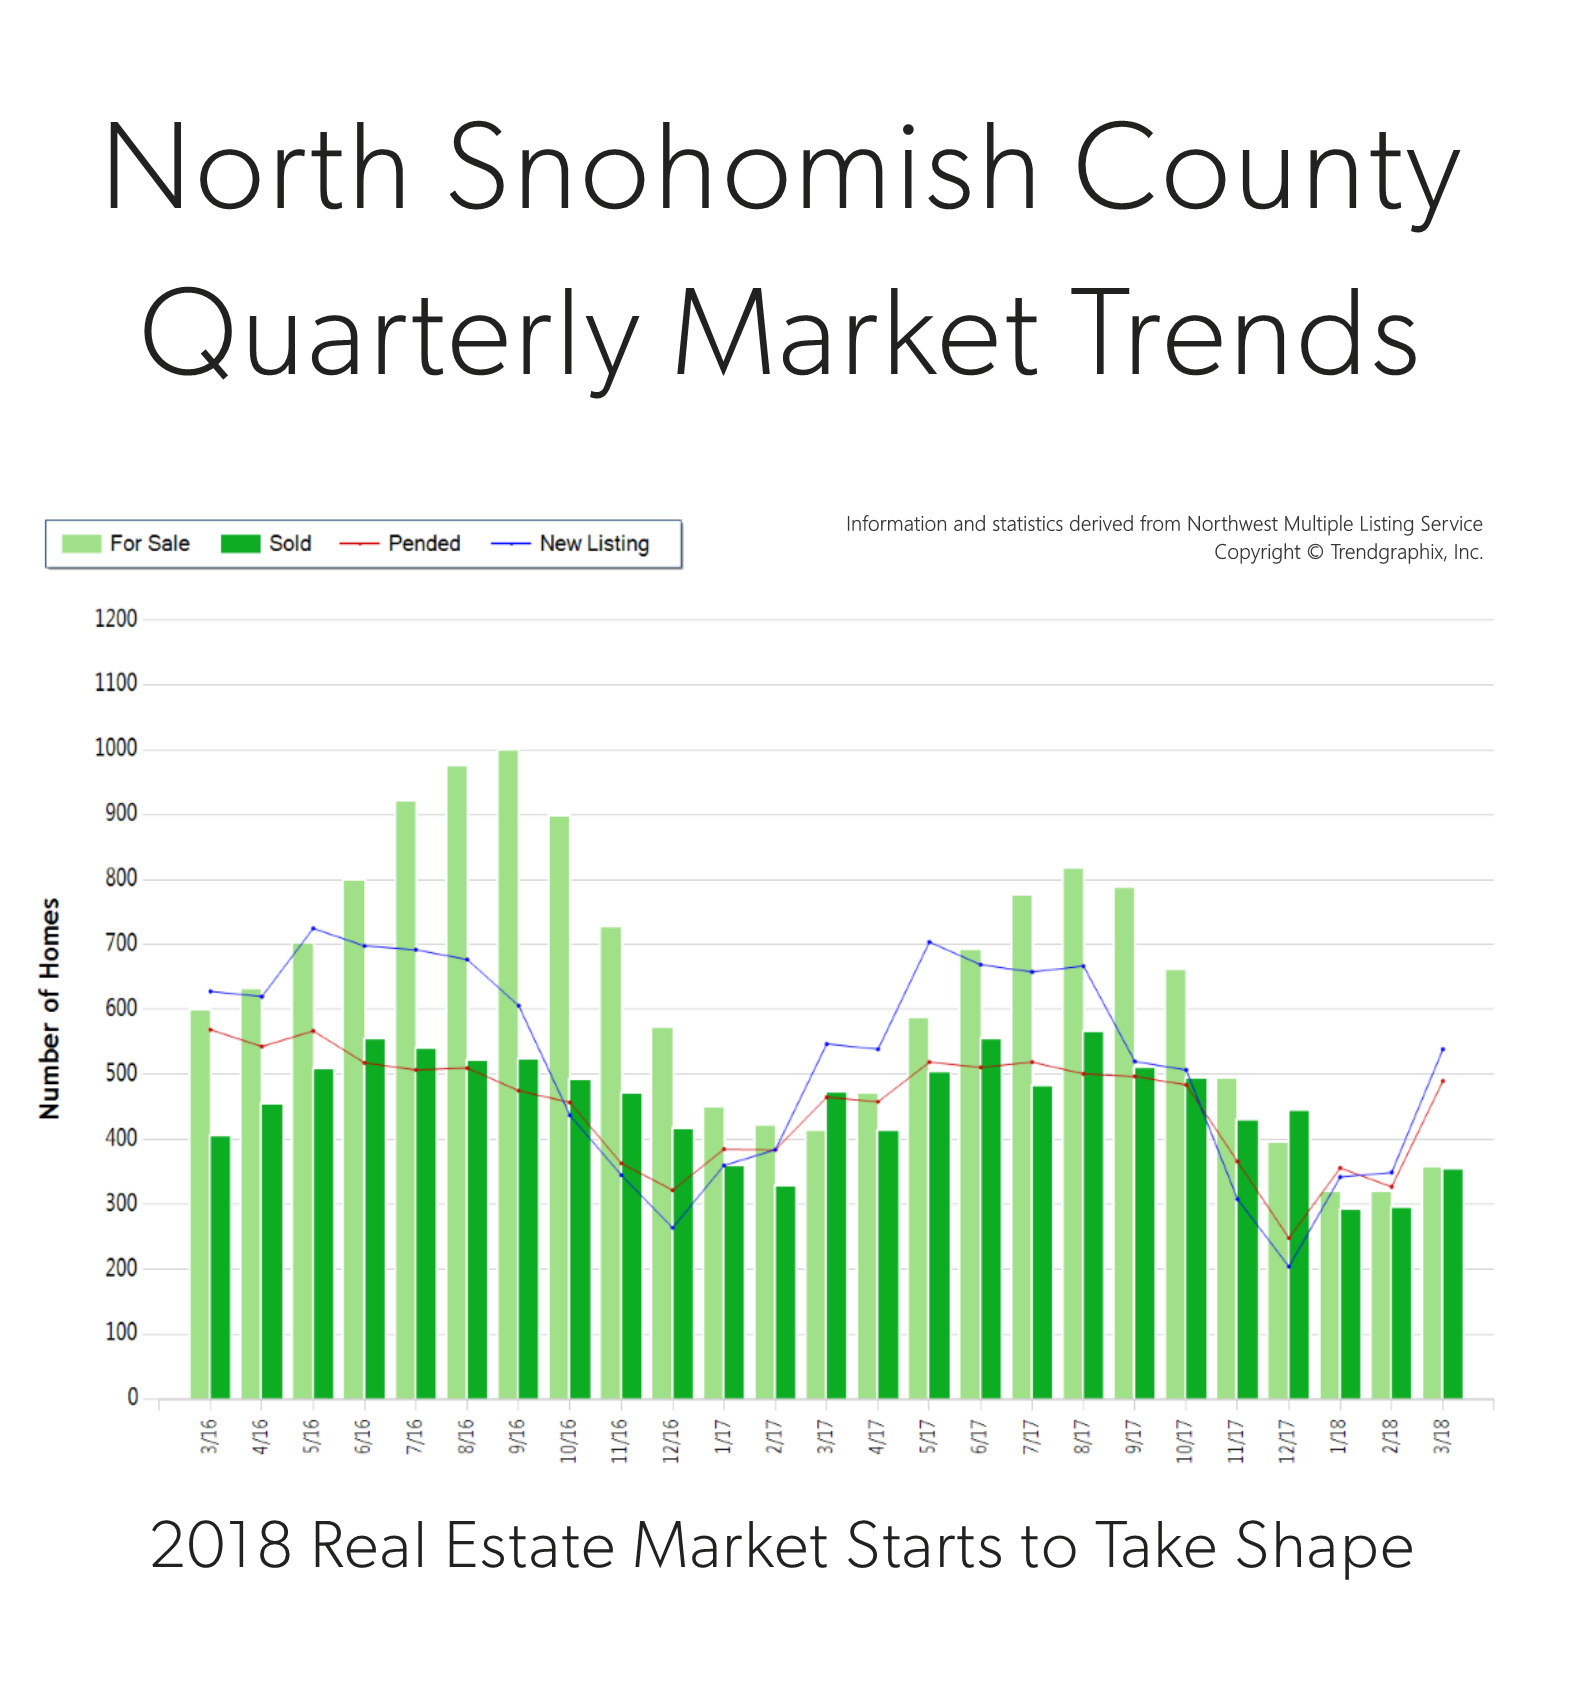

It is the time of year when our market starts to take off. Spring is here and we are starting to see seasonal increases in inventory. In fact, there was a 54% increase in new listings in March compared to February. That increase was matched by a 50% rise in pending sales, illustrating very strong demand for housing in your area. Last month, the average list-to-sale price ratio was 100%, and average days on market was 35 days. We ended the quarter with 0.7 months of inventory – the lowest level yet. More inventory would be absorbed by happy buyers looking for more selection and would help temper price growth, which is up 12% year-over-year.
North Snohomish County is one of the most affordable markets in the area. In fact, the median price in March was 28% higher in south Snohomish County. Buyers are migrating to the area, especially if they don’t have to commute into the city. Sellers are enjoying amazing returns due to this phenomenon, and buyers are securing mortgages with minor debt service due to low interest rates. This is a very strong seller’s market, but buyers who are securing a home are already enjoying appreciation in equity.
This is only a snapshot of the trends in north Snohomish County; please contact me if you would like further explanation of how the latest trends relate to you.


Cost vs Value: Front Door
I am commonly asked which improvements sellers should make to get the greatest return on their home sale. Every year The Remodeling 2018 Cost vs. Value Report (www.costvsvalue.com) compiles all the information and analyzes the estimated percentage return on home improvements in each region. Getting a home prepared for market requires a keen eye and great resources. To access the entire Cost vs. Value report please visit www.costvsvalue.com and follow the steps to locate the Seattle area report.
Also, I have a great list of reputable contractors from HVAC to plumbing to roofing who are licensed and bonded in the State of Washington. Please call on me whenever you need a solid recommendation. I am happy to help whether you are getting your home ready for market or just want to find a good window washer now that the sun is starting to shine a little more.
Complete data from the Remodeling 2018 Cost vs. Value Report can be downloaded free at www.costvsvalue.com
© Hanley Wood Media Inc.
