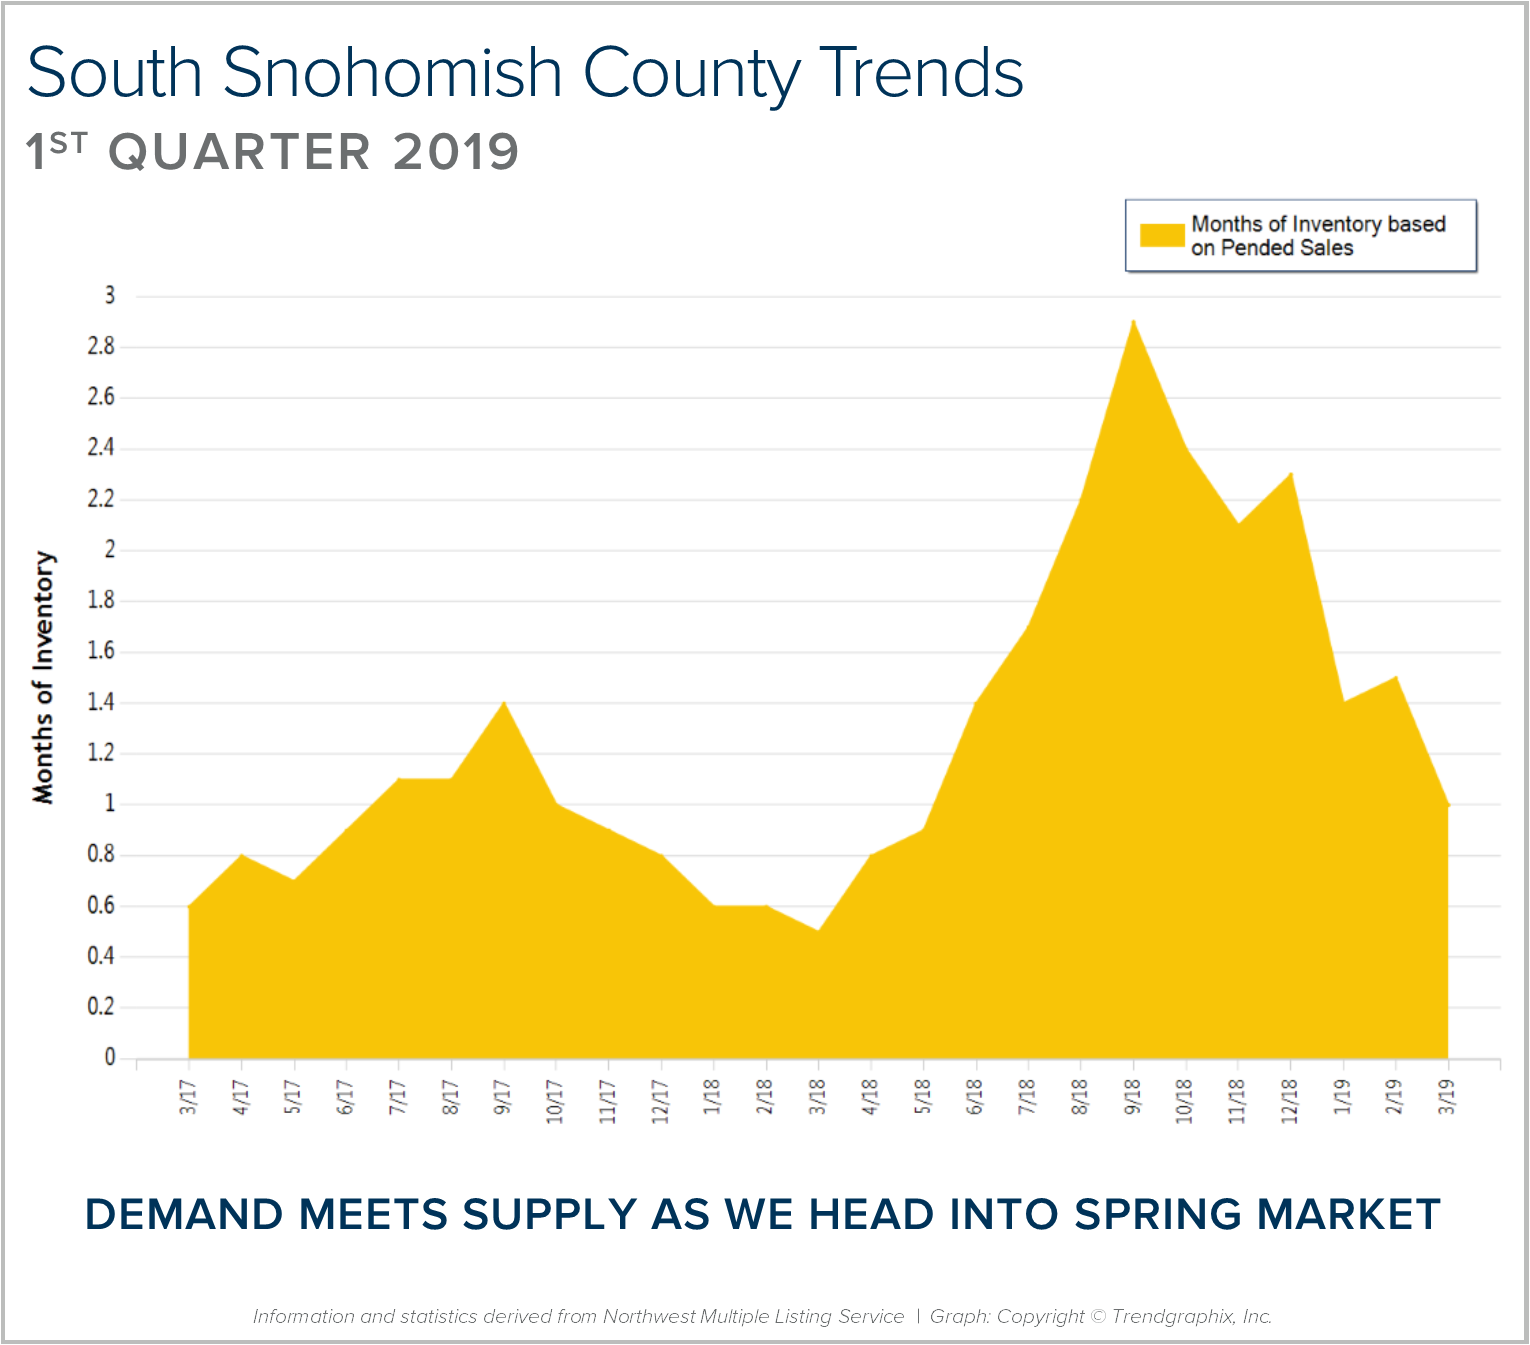
Months of inventory was reduced as we finished out the first quarter of 2019. Months of inventory is the amount of months it would take to sell out of homes if no new listings came to market. This illustrates the balance between supply and demand. We peaked at 2.8 months in September of 2018 and found ourselves at 1 month this March.
The first quarter of 2019 saw 1,708 new listings and 1,547 pending sales – demand tracked quite well with supply! It remains a seller’s market (0-3 months of inventory), but not as constricted of a market as last year, which saw an average of 0.6 months in the first quarter compared to 1.3 months this year. As we head into spring, we should see continued growth in new listings and demand will be strong, fueled by low interest rates and positive jobs reports.
The second half of 2018 had a large influx of homes that came to market, and an interest rate jump which created a gap between supply and demand. Buyers enjoyed some negotiations and credits in the fall and winter due to more selection, but as interest rates reduced in the first quarter, we saw demand increase. This is helping to absorb inventory and reduce the average days on market it takes to sell a home. Median price is up 6% complete year-over-year, which is still higher than the 4% norm, but much less than the unsustainable 15% gains from 2017 to 2018. This balancing out in the market has been a positive phenomenon as affordability has been a challenge for many. Both sellers and buyers are finding great opportunities in the current market.
This is only a snapshot of the trends in south Snohomish County; please contact me if you would like further explanation of how the latest trends relate to you.
Spring is in the air! The bulbs are starting to poke out of the ground and we recently hit 70 degrees in the Greater Seattle area. This is the time of year, due to weather and the end of the school year approaching, that the local real estate market starts to take off with activity. Not only is the sun thawing out gardens and backyard patios, helping to ready homes for market, but interest rates are continuing to fall, providing a heyday for buyers and sellers.
Spring is the time of year we see more homes come to market providing more selection for buyers. This is what we call our peak season. This spring, however, is especially meaningful due to the recent decrease in interest rates. Seasonality naturally brings more activity, but 2019 has started out with a downward trajectory in regards to interest rates, which has been a welcome shift after watching rates increase by almost an entire point over the course of 2018.
We are beginning to see a ton of activity at open houses, market times are starting to shrink, and multiple offers are popping up again. Demand is on the rise, with first-time home buyers out in full-force along with move-up and down-size buyers all going after the same inventory. Price appreciation will start to happen again month-over-month as the tulips start to open and veggie gardens start sprouting.
This assessment is not only factual and researched, it is anecdotal. You see, statistics are only reported monthly from the NWMLS, so the stories from the streets tell the real story of where we have been, what’s happening now, and where we are headed in the real estate market. My daily engagement with the market, either helping buyers or sellers, researching values, showing properties, negotiating contracts, and working on inspections and appraisals helps me to be informed of the trends before they are even reported.
Around the third of each month, the NWMLS distributes a press release to the media reporting the previous month’s statistics. The media grabs the numbers that are most exciting to them to craft a story around. They create headlines to entice readership, which in turn sells advertising. The problem is that these news stories often only tell part of the story.
A classic example of cherry picked statistics used to create a headline came earlier this month. The Seattle Times reported in a sub-headline that Snohomish County home prices were falling at their fastest rate in seven years. This is simply not the whole truth. This is a common tactic of the media often only using month-over-month numbers (comparing the current month to the same month a year ago) versus a complete year-over-year analysis. Real estate is a long-term investment, and month-over-month numbers tend to provide more of a snapshot rather than a longer-term analysis of data and what influenced it.
We need to look at the data from all angles. Where were we a year ago, what has happened over the course of the last year in comparison to the previous year, and what happened this month compared to last month? Real-time experiences matter too, as the market changes weekly and even daily. Interactions throughout the month help me understand what opportunities the current environment will provide before the ink even dries on the media release. All of this helps us understand where we have come from and where we are headed. Couple that with front-line, daily experiences, and your trusted advisor can help you determine how all of this relates to your bottom line much more effectively than an article in the newspaper.
Another important factor to consider is that the bulk of the statistics reported in that monthly NWMLS press release are based on closed sales. While closed sales are very important, we must also closely track pending sales activity (homes currently under contract). Closed sales show where we have been and pending sales indicate where we are headed. February was a misleading month because of Snowmageddon. It halted new inventory reaching the market and kept buyers at home. The second half of February once the roads were cleared, had buyers lined up. Many of those buyers are anxiously waiting for that seasonal surge in inventory as we head into spring. This is indicated by conversations being had at open houses and one-on-one encounters with clients. Buyers want to take advantage of these surprisingly low interest rates now and sellers are enjoying the audience they are providing.
Unfortunately, the media is the initial source of information, and sometimes the only source a consumer considers when making such big decisions. I can’t tell you how often I encounter people that are grossly misled by alarming headlines and bite-sized bits of media when it comes to their largest asset, or the consideration of entering into home ownership.
Supply and demand illustrates where we are at in the market, and factors such as interest rates, the local and global economy, and simple things like weather and consumer mindset drive the market. Consumer mindset is influenced by the media. Take it a step further and make sure you are aligned with a professional who is committed to tracking all of this and can help explain how it all relates to you. Everyone has their own goals and their own concerns; it is the analysis of a well-researched trusted advisor that can help you navigate these meaningful financial decisions. It is my goal to provide my clients with the most up-to-date information to help empower strong decisions. If you are curious how this all relates to you, please reach out. I’d be happy to discuss and help educate.
Growing your own vegetables is both fun and rewarding. It might seem intimidating if you’ve never done it before, but once you get started, you’ll find it isn’t very hard. Gardening is a learning experience, though. You’ll find that some things work better than others, and every planting season gives you another opportunity to make some tweaks and try again.
The first thing you need to decide is where to plant. For most veggies, this should be the sunniest spot you have. And of course, the second big question is what to plant. Go for the things you love to eat, as well as plants that will thrive in the amount of sun you have.
Our climate in the Pacific Northwest requires some crops to be started indoors in the winter and transplanted outside in the spring. But it’s not too late to get started. There are lots of plants that you can sow directly into the garden in early spring. Here are a few:
There are also many crops that can be planted in the summer for a fall harvest. Click here for a complete timeline of planting vegetables in the Seattle area.
Celebrate Earth Day with us! Bring all your sensitive documents to be professionally destroyed on-site by Confidential Data Disposal. Limit 20 file boxes per customer.
We will also be collecting non-perishable food and cash donations to benefit Concern for Neighbors Food Bank. Donations are not required, but are appreciated.
Don’t miss the spring Home Show at CenturyLink Field Event Center, Feb 23 – Mar 3. You’ll find exhibits about building, remodeling, decorating and landscaping. http://seattlehomeshow.com/show-info/
February is a great time to be indoors at the Northwest Flower and Garden Festival! Feb 2/20-24 at the WA State Convention Center. Find 100 world-class seminars FREE. This is the best event to gather ideas and inspiration. Whether you’re a seasoned gardener or just starting to dig in the dirt, there’s something for everyone! https://gardenshow.com/
Winter’s not over yet, but spring is right around the corner. Here are some helpful tips to freshen up your house for spring:
Whether you hire an outside professional for help, or tackle the project yourself, now is a great time to get a jump on spring cleaning. Many people wait for warmer temps to start cleaning, but I think most everyone can agree that those weekends would be better spent outdoors, soaking up that sun. So, take some inspiration from the list below to get you started now on freshening up your home for spring.
It will only take a few hours to check everything off this list, and you’ll feel so much better enjoying the last few weeks of winter, knowing that when the warmer weather finally comes, you can get outside and really enjoy it!
Rotate your mattress. Most mattresses need to be rotated regularly in order to even out the overall wear and prolong the lifespan of your bed. However, keep in mind that Sleep Number and Tempur-Pedic mattresses typically should not be rotated. Always check with your manufacturer for their recommendations on your specific mattress. If you own an older mattress with no pillowtop, it should probably be flipped as well as rotated.
Clean your mattress. Strip the mattress of all linens and covers. Start by vacuuming the mattress with the upholstery attachment, paying close attention to crevices and seams. Next, sprinkle baking soda (up to a one-pound box) all over the surface of your mattress. Let this sit for at least an hour, but 24 hours is best. Then go back over your mattress with your vacuum’s upholstery attachment again. If you have a steam cleaner, break it out and go over your whole mattress. The steam will reach further into the mattress than your vacuum is able to, and kills dust mites. *It is generally not recommended to clean memory foam with a steam cleaner.
Organize & clean the laundry room. Clean the outside of your washer and dryer; scrape any dried detergent from crevices. Next, clean the inside of the washing machine. Most newer models have a self-cleaning cycle. If you have an older machine that does not have a self-cleaning cycle, run a cycle with hot water and a quart of white vinegar. After it is finished, clean the detergent dispensers, using a vinegar and water solution and a scrubber. If you have a front-loader, be sure to clean the rubber seal on the door. This area is prone to mold growth, so use an all-purpose cleaner or maybe even bleach to get under and around the seal.
Next, organize a bit. Throw away products you never use, replace damaged sorting bins, and don’t forget to clean out the dryer vent to prevent a fire.
Deep clean the fridge. Twice a year (or more), you should give your fridge a front-to-back, top-down scrubbing. Start by taking everything out and throw away anything that has expired. Next, remove all the shelves and drawers. Put them to soak in a solution of two tablespoons baking soda and one-quart hot water. While they are soaking, wipe down the interior of the fridge with the same solution. Then scrub, rinse and dry the shelves and drawers.
Next, dry the drip pan. Remove the base grill, and pull out the drip pan. If it’s full of water, mop it with paper towels and wash the pan with soapy water. If your drop pan is fixed in place, wrap a cloth around the head of a long-handled brush and use to clean the pan.
Don’t forget the coils. In order to keep your refrigerator running efficiently, unplug it, pull it away from the wall, and use a coil brush or your vacuum’s crevice attachment to clean the condenser coils. This should be done at least twice a year, unless you have pets in the home, and then you should do this three to four times a year.
Clean out spice cabinet. Throw away all expired spices and seasonings. Not only do these lose taste, they actually harbor mold and bacteria.
Clean out expired medications & vitamins If you have unused medications, please take them to your local pharmacy for proper disposal.
Vacuum, wash, or steam window curtains
Wash window blinds
Add color to your table. Treat yourself to fresh flowers while waiting for the spring blooms outside.
At Windermere we help people buy and sell homes, but we also help build community. I’m proud to support the Windermere Foundation which has raised over $38 million in the past 30 years for low-income and homeless families right here in our local community. http://bit.ly/2Dtjt7f
Don’t miss your opportunity to support up-and-coming filmmakers during this fun, community event this weekend! Tickets are $20, parking is free, and popcorn, candy, soda, wine, and beer will be available for purchase. http://www.shorelinearts.net/shortshortfilmfestival/
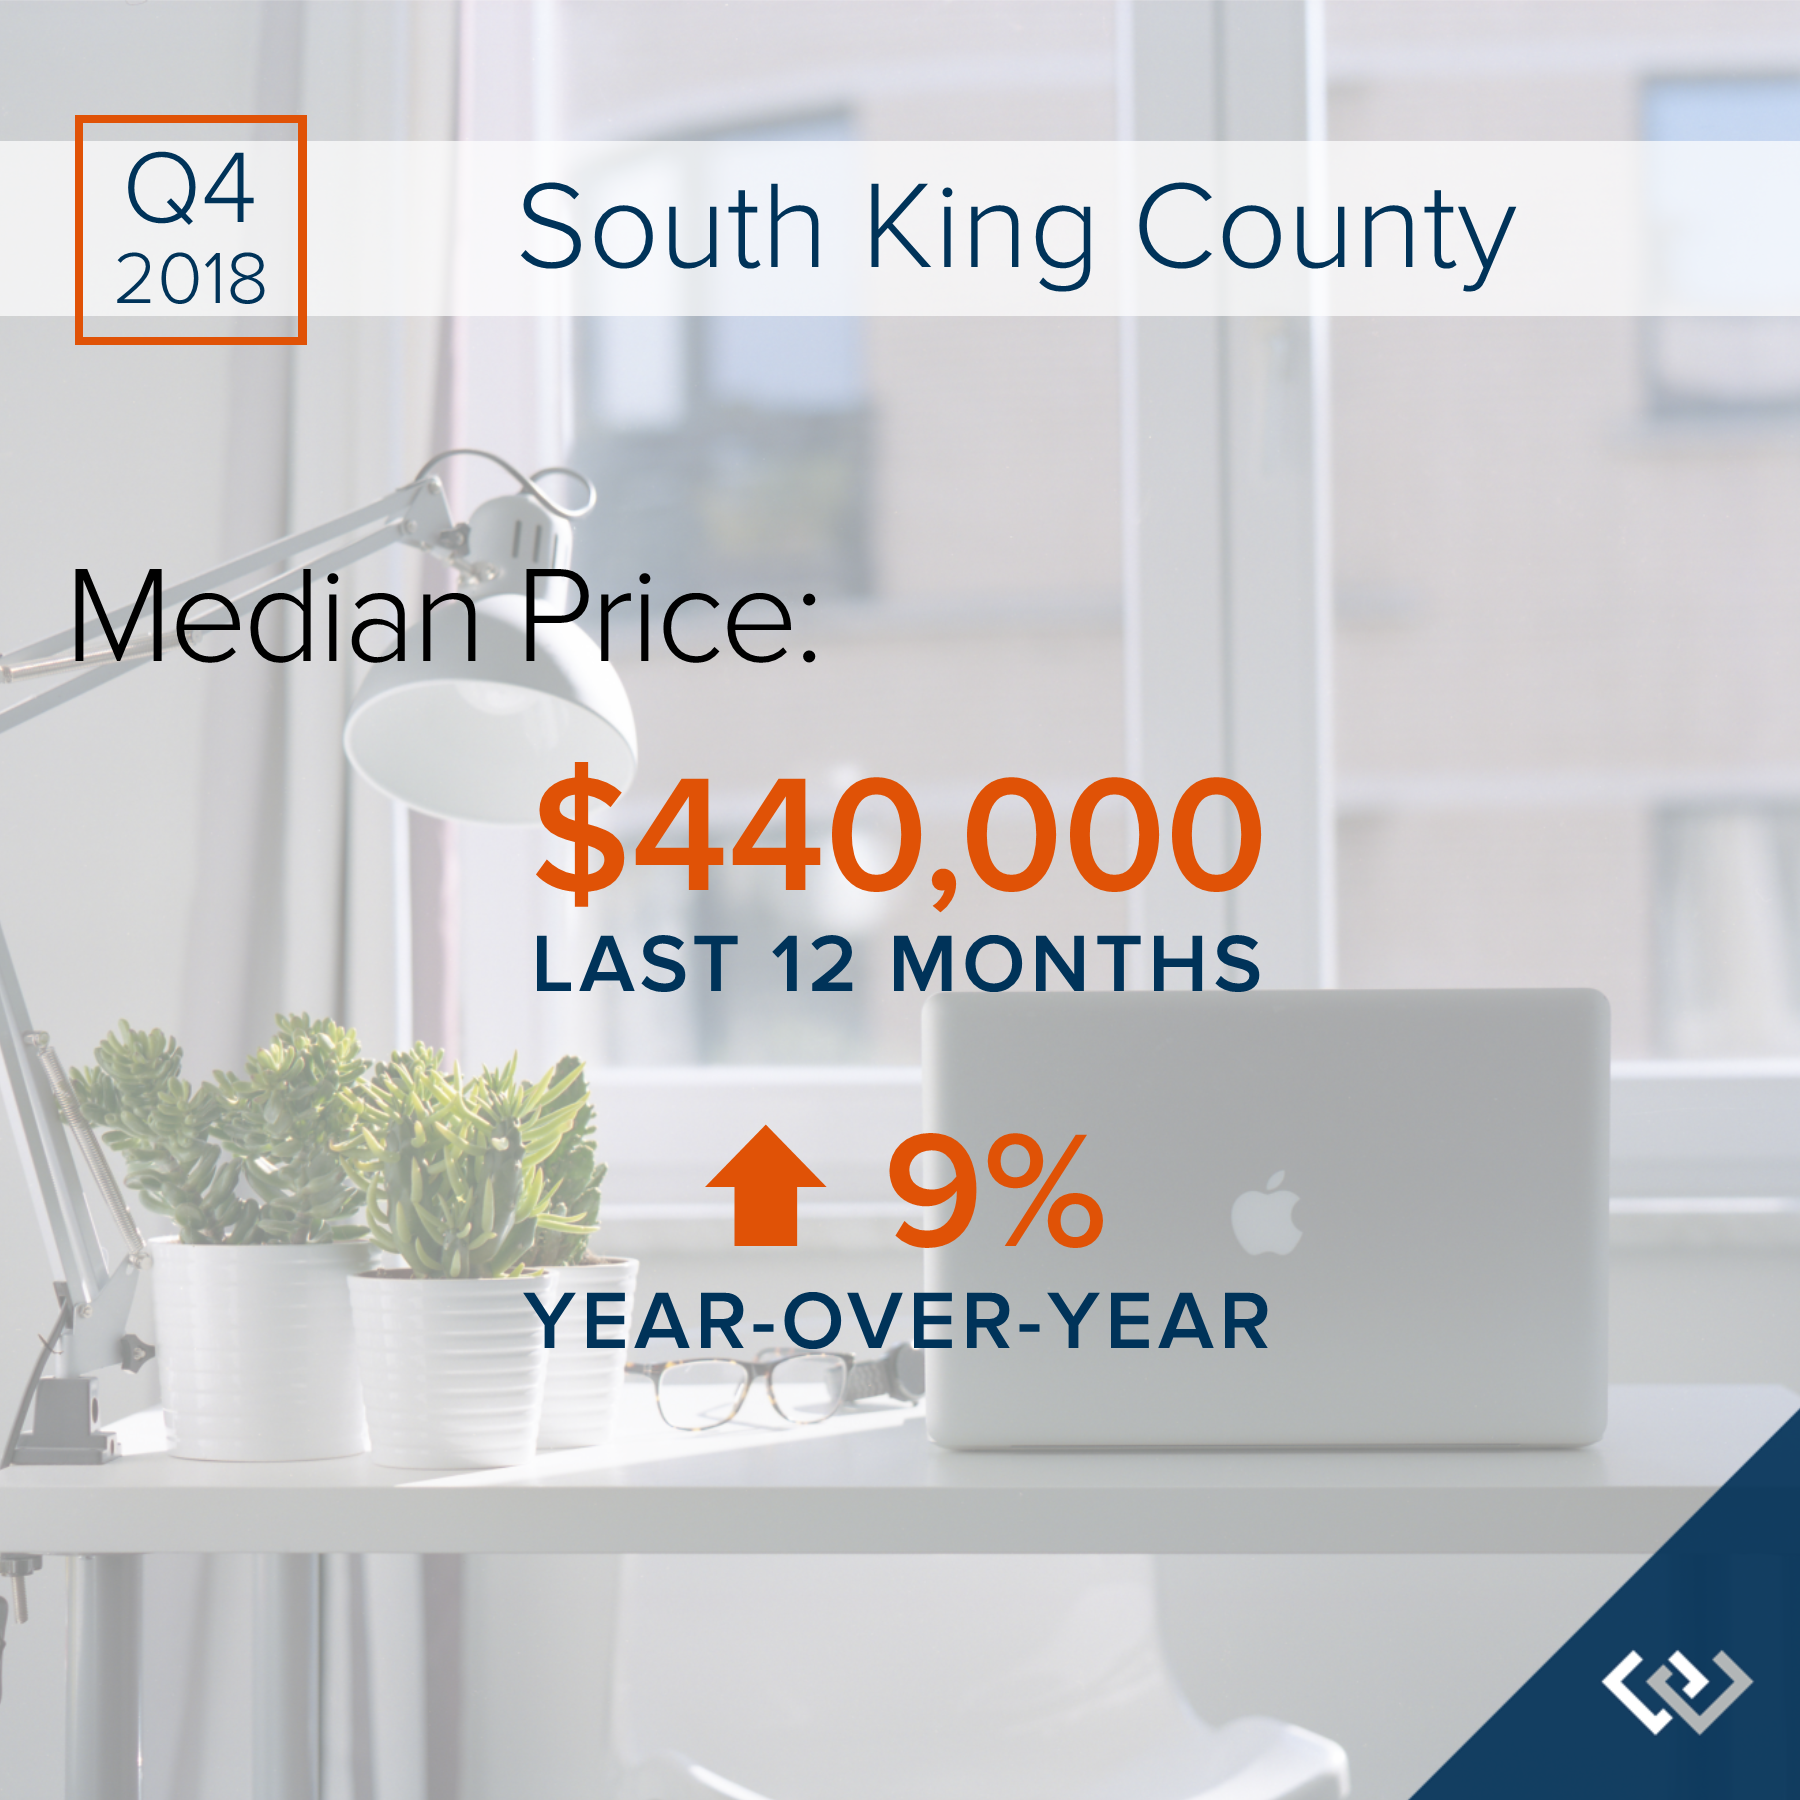
2018 was a year of change and growth. The market shifted from an extreme seller’s market, but still had strong gains. Year-over-year, median price is up 9% and since 2012 has increased 89%! Over the last 19 years, the average year-over-year price increase has been 6%. This puts into perspective the growth we have experienced, resulting in well-established equity levels. In 2018, inventory averaged 1.7 months, 30% more than 2017. This caused the month-over-month price gains to slow, and we experienced a price correction over the second half of the year. We expect to see more average levels of price appreciation in 2019 as the market continues to balance out.
After six years of expansion resulting in an extreme seller’s market, in 2018 we encountered a market shift in the late spring. Inventory increased, interest rates took a jump, and demand took a step back to re-evaluate the new playing field. This resulted in a tempering of month-over-month price appreciation, and has established some long-awaited balance. This balance has brought opportunities for both buyers and sellers. Buyers have more selection and are negotiating terms like inspection items and concessions. Sellers are sitting on 6+ years of equity growth, and are now able to sell their home and make a move without fearing where they will land next. Interest rates are still well below the 30-year average, currently hovering just under 5%. We are seeing demand start to re-engage now that the new normal has settled in.
This is only a snapshot of the trends in south King County; please contact me if you would like further explanation of how the latest trends relate to you.

 Facebook
 X
X
 Pinterest
 Copy Link
 Months of inventory was reduced as we finished out the first quarter of 2019. Months of inventory is the amount of months it would take to sell out of homes if no new listings came to market. This illustrates the balance between supply and demand. We peaked at 2.8 months in September of 2018 and found ourselves at 1 month this March.