
 Facebook
 X
X
 Pinterest
 Copy Link
Seattle Metro Quarterly Market Trends •
July 27, 2018
Seattle Metro Quarterly Market Update – Q2 2018
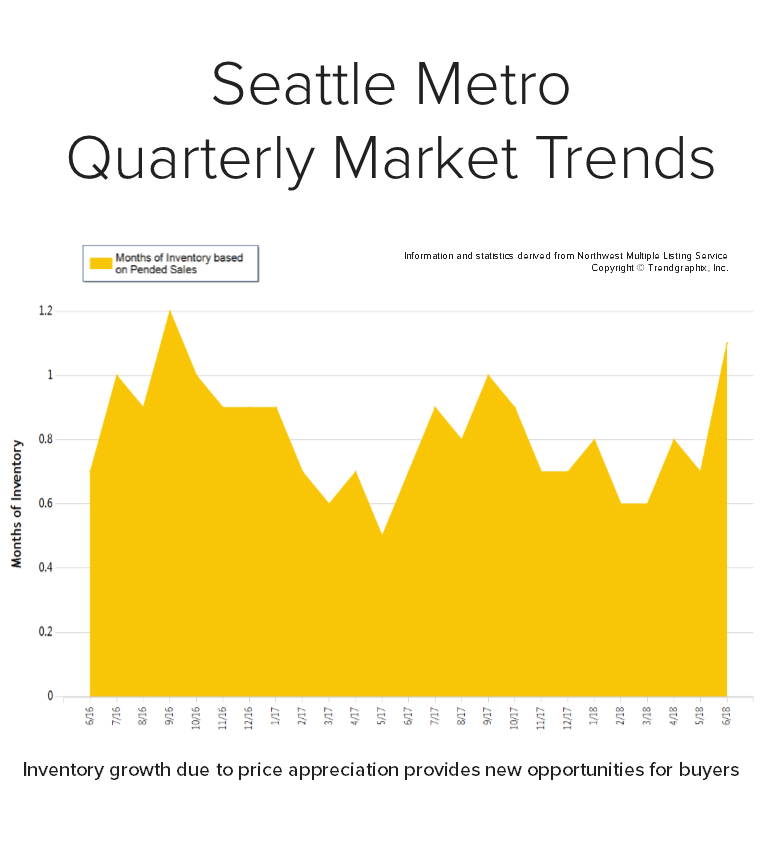

As we head into the summer months we are seeing a healthy jump in inventory in our area. In May, we saw the biggest jump in new listings in a decade! Price appreciation has created this phenomenon, motivating many people to make big moves with their equity. In fact, prices are up 15% year-over-year. We currently sit at 1.1 months of inventory based on pending sales. This more-equal balance of homes for sale compared to the first quarter has created great opportunities for buyers, finally! While it is still a seller’s market, it has eased up a bit. The average days on market in June was 15 days and the average list-to-sale price ratio was 102%.
Seattle Metro real estate has a very high premium due to close-in commute times and vibrant neighborhoods. In fact, the median price in June was $800,000. Sellers are enjoying great returns due to buyers choosing to lay down roots in our area, and buyers are securing mortgages with minor debt service due to low interest rates. The easing of inventory is a welcome change and is helping to temper price growth.
This is only a snapshot of the trends in the Seattle Metro area; please contact me if you would like further explanation of how the latest trends relate to you.
South King Co Market Trends •
July 27, 2018
South King Co. Quarterly Market Trends – Q2 2018
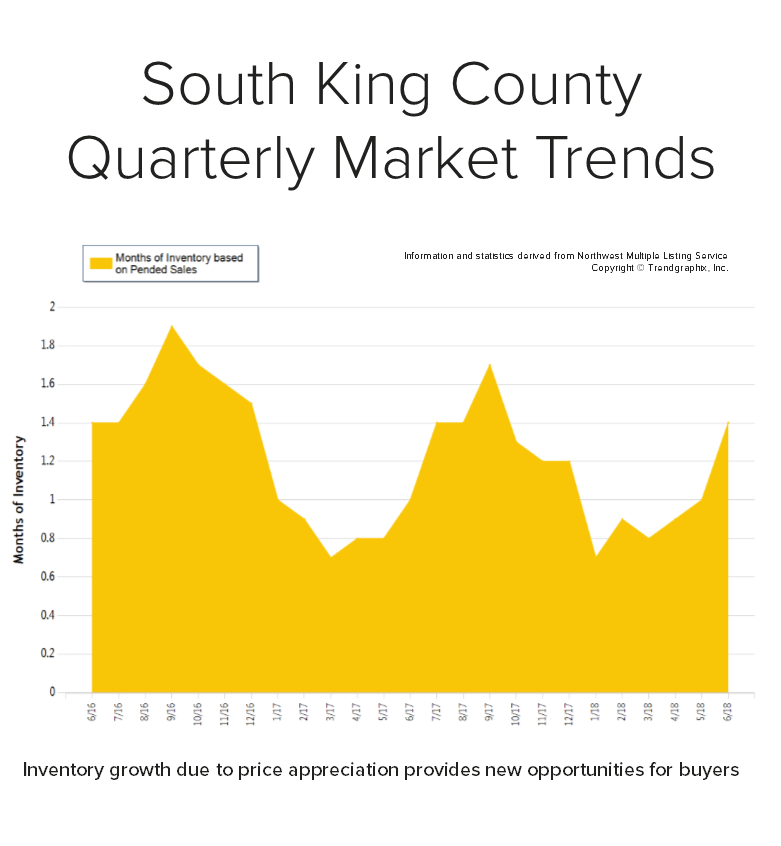

As we head into the summer months we are seeing a healthy jump in inventory in our area. In May, we saw the biggest jump in new listings in a decade! Price appreciation has created this phenomenon, motivating many people to make big moves with their equity. In fact, prices are up 13% year-over-year. We currently sit at 1.4 months of inventory based on pending sales. This more-equal balance of homes for sale compared to the first quarter has created great opportunities for buyers, finally! While it is still a seller’s market, it has eased up a bit. The average days on market in June was 15 days and the average list-to-sale price ratio was 101%.
South King County real estate has been an affordable option compared to “in-city” real estate. In fact, the median price in June was 75% higher in Seattle Metro. Sellers are enjoying great returns due to buyers choosing to lay down roots in our area, and buyers are securing mortgages with minor debt service due to low interest rates. The easing of inventory is a welcome change and is helping to temper price growth.
This is only a snapshot of the trends in south King County; please contact me if you would like further explanation of how the latest trends relate to you.
South Snohomish Co Quarterly Market Trends •
July 27, 2018
South Snohomish Co. Quarterly Market Trends – Q2 2018
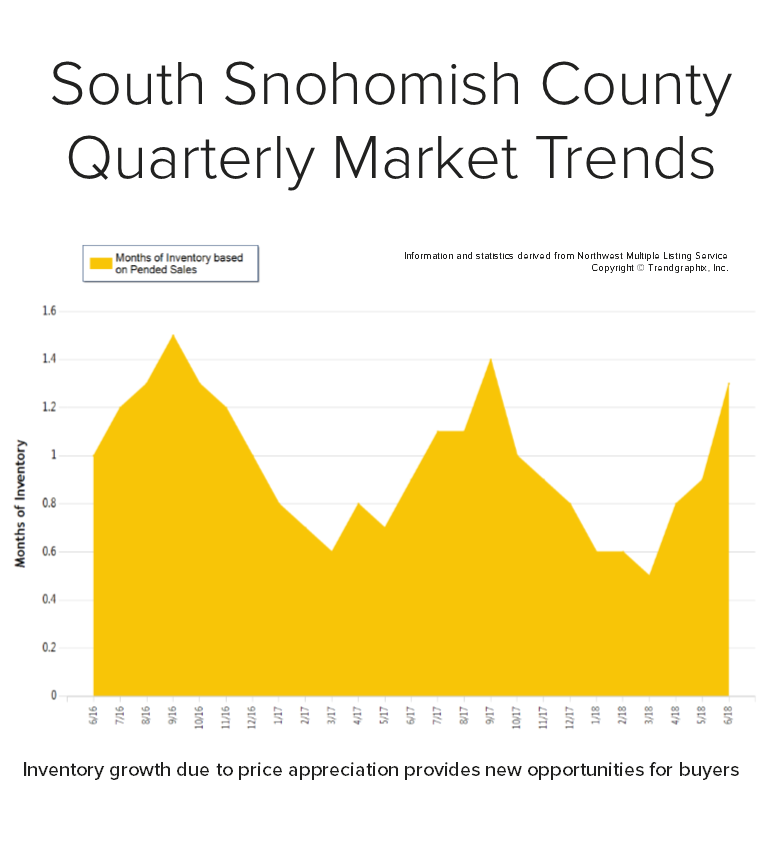

As we head into the summer months we are seeing a healthy jump in inventory in our area. In May, we saw the biggest jump in new listings in a decade! Price appreciation has created this phenomenon, motivating many people to make big moves with their equity. In fact, prices are up 13% year-over-year. We currently sit at 1.3 months of inventory based on pending sales. This more-equal balance of homes for sale compared to the first quarter has created great opportunities for buyers, finally! While it is still a seller’s market, it has eased up a bit. The average days on market in June was 11 days and the average list-to-sale price ratio was 102%.
South Snohomish County real estate has been an affordable option compared to “in-city” real estate. In fact, the median price in June was 41% higher in Seattle Metro. Sellers are enjoying great returns due to buyers choosing to lay down roots in our area, and buyers are securing mortgages with minor debt service due to low interest rates. The easing of inventory is a welcome change and is helping to temper price growth.
This is only a snapshot of the trends in south Snohomish County; please contact me if you would like further explanation of how the latest trends relate to you.
North Snohomish Co Quarterly Market Trends •
July 27, 2018
North Snohomish Co. Quarterly Market Trends – Q2 2018
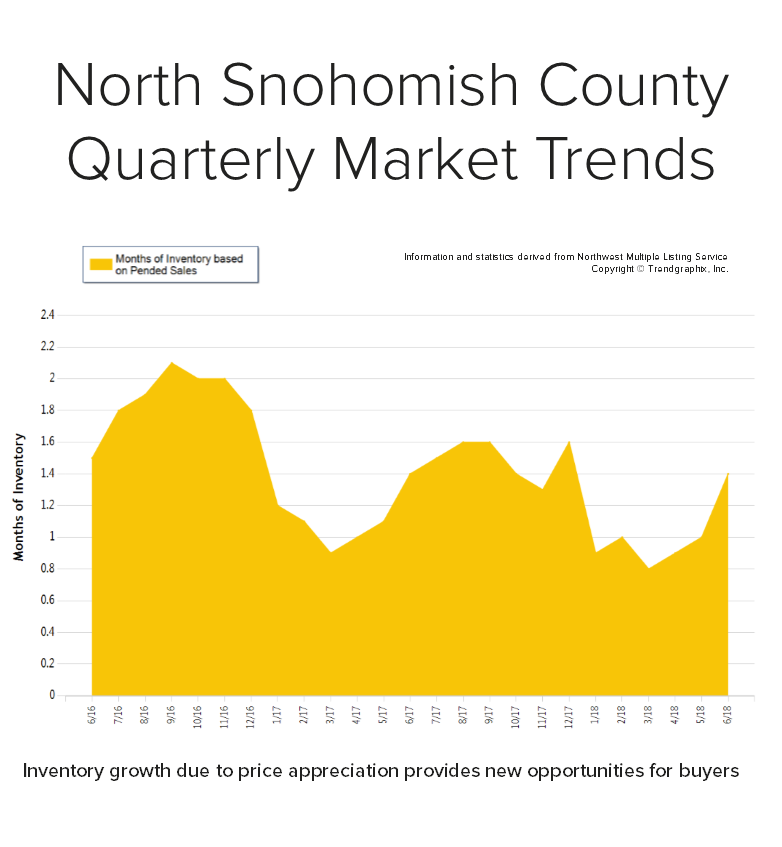

As we head into the summer months we are seeing a healthy jump in inventory in our area. In May, we saw the biggest jump in new listings in a decade! Price appreciation has created this phenomenon, motivating many people to make big moves with their equity. In fact, prices are up 11% year-over-year. We currently sit at 1.4 months of inventory based on pending sales. This more-equal balance of homes for sale compared to the first quarter has created great opportunities for buyers, finally! While it is still a seller’s market, it has eased up a bit. The average days on market in June was 21 days and the average list-to-sale price ratio was 101%.
North Snohomish County real estate has been an affordable option compared to “in-city” real estate. In fact, the median price in June was 86% higher in Seattle Metro. Sellers are enjoying great returns due to buyers choosing to lay down roots in our area, and buyers are securing mortgages with minor debt service due to low interest rates. The easing of inventory is a welcome change and is helping to temper price growth.
This is only a snapshot of the trends in north Snohomish County; please contact me if you would like further explanation of how the latest trends relate to you.
North King Co Quarterly Market Trends •
July 27, 2018
North King Co. Quarterly Market Trends – Q2 2018
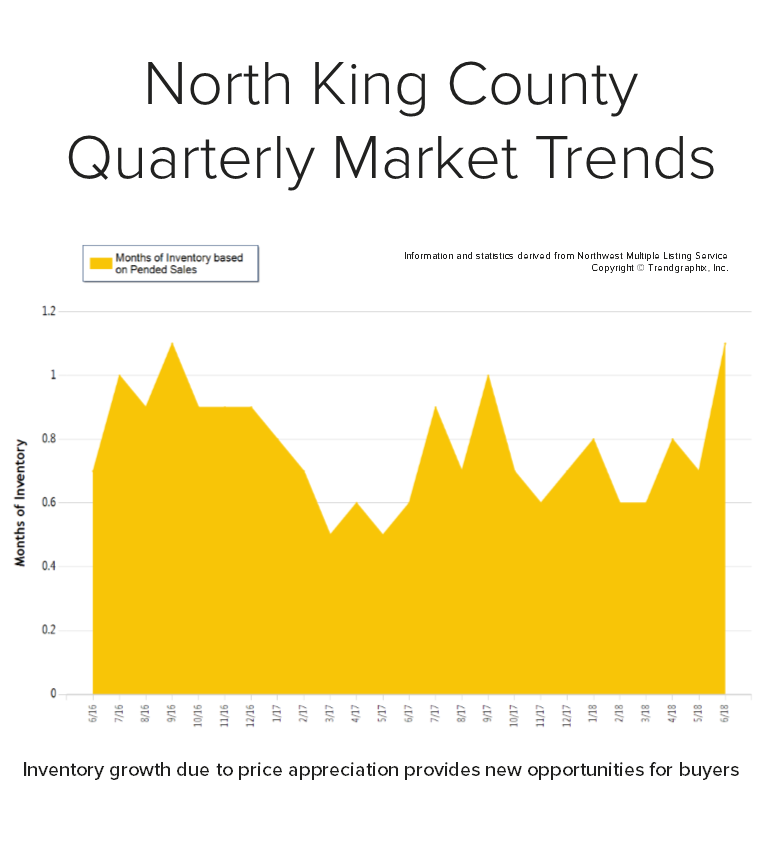

As we head into the summer months we are seeing a healthy jump in inventory in our area. In May, we saw the biggest jump in new listings in a decade! Price appreciation has created this phenomenon, motivating many people to make big moves with their equity. In fact, prices are up 13% year-over-year. We currently sit at 1.1 months of inventory based on pending sales. This more-equal balance of homes for sale compared to the first quarter has created great opportunities for buyers, finally! While it is still a seller’s market, it has eased up a bit. The average days on market in June was 16 days and the average list-to-sale price ratio was 103%.
North King County real estate has a very high premium due to close-in commute times and vibrant neighborhoods. In fact, the median price in June was $800,000. Sellers are enjoying great returns due to buyers choosing to lay down roots in our area, and buyers are securing mortgages with minor debt service due to low interest rates. The easing of inventory is a welcome change and is helping to temper price growth.
This is only a snapshot of the trends in north King County; please contact me if you would like further explanation of how the latest trends relate to you.
Eastside Quarterly Market Trends •
July 26, 2018
Eastside Quarterly Market Trends – Q2 2018
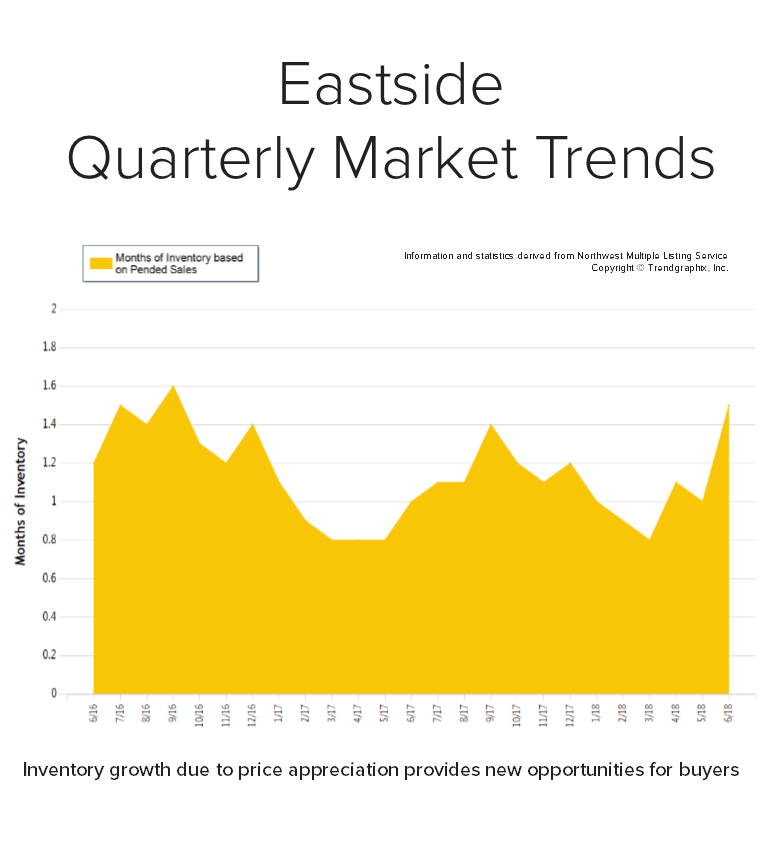

As we head into the summer months we are seeing a healthy jump in inventory in our area. In May, we saw the biggest jump in new listings in a decade! Price appreciation has created this phenomenon, motivating many people to make big moves with their equity. In fact, prices are up 11% year-over-year. We currently sit at 1.5 months of inventory based on pending sales. This more-equal balance of homes for sale compared to the first quarter has created great opportunities for buyers, finally! While it is still a seller’s market, it has eased up a bit. The average days on market in June was 19 days and the average list-to-sale price ratio was 101%.
Eastside real estate has a very high premium due to close-in commute times, great neighborhoods and strong school districts. In fact, the median price in June was $980,000. Sellers are enjoying great returns due to buyers choosing to lay down roots in our area, and buyers are securing mortgages with minor debt service due to low interest rates. The easing of inventory is a welcome change and is helping to temper price growth.
This is only a snapshot of the trends on the Eastside; please contact me if you would like further explanation of how the latest trends relate to you.
Housing News •
July 9, 2018
KCM Pent Up Demand
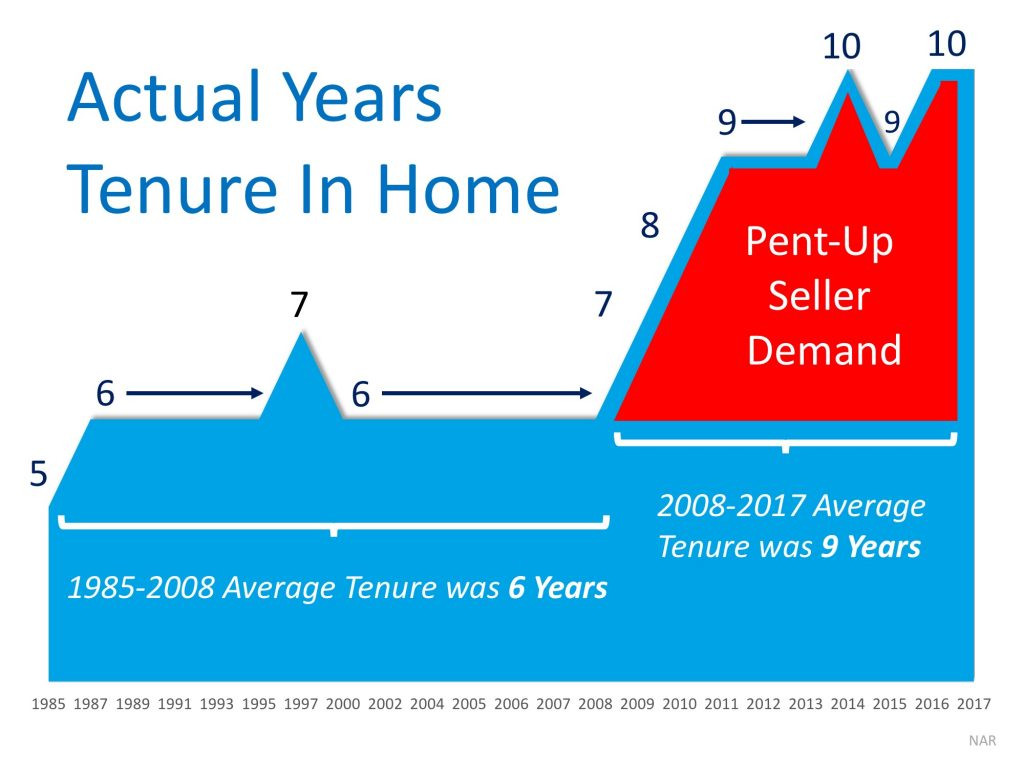
Have you been considering a move? Folks are staying in their homes longer than before, this is attributing to the increase in inventory as people choose to come to the market. Where is your next move?

Housing News •
July 9, 2018
KCM Home Equity by County – Nationwide
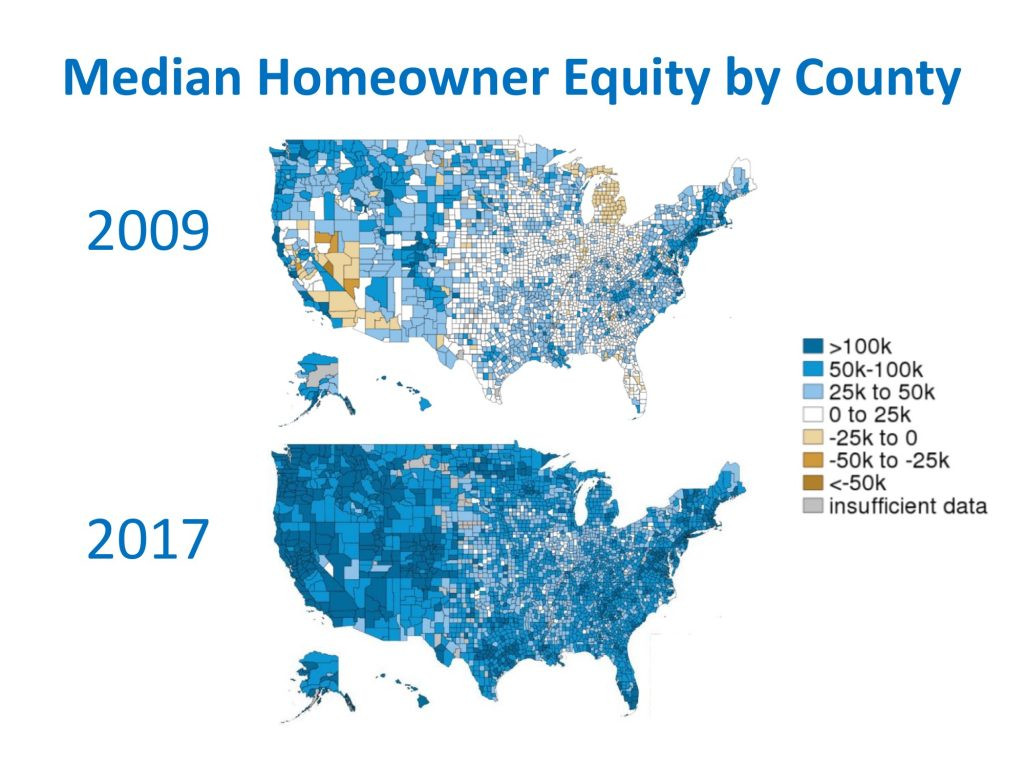
Equity levels have improved quite a bit over the last 10 years. Appreciation and the size of down payments play into this. This overall position is one that can be utilized to make moves or sustain your nest egg by staying in place. What are your goals?

Uncategorized •
June 14, 2018
Outdoor Movie Schedule: Summer 2018


Don’t forget your blanket and the popcorn! It is the time of year when it’s nice enough to grab a movie outdoors – how fun! Here is a list of local outdoor movies planned for this summer.
Snohomish County
Terrace Park
7/6 Star Wars: The Last Jedi (at the Airport Fly In)
7/12 Early Man
7/19 Peter Rabbit
Frances Anderson Center Field
7/27 Moana
8/3 Wonder
Everett’s Cinema Under the Stars
Thornton Sullivan Park, Camp Patterson Field
7/20 Early Man
7/27 Coco
8/3 Wonder
8/10 Moana
8/17 Guardians of the Galaxy Vol
Marysville Popcorn in the Park
Jennings Park, Lioins Centennial Pavilion
7/14 Despicable Me 3
7/21 Jumanji
7/28 Cars 3
8/4 Wonder Woman
8/11 Star Wars: The Last Jedi
Sundquist Family Movies in the Park
Willis Tucker Park
7/12 Jumanji
7/19 Ferdinand
7/26 The Greatest Showman
8/2 Coco
8/9 Wonder
8/16 Beauty and the Beast
Eastside
Downtown Park
7/10 Despicable Me 3
7/17 Boss Baby
7/24 The Lego Ninjago Movie
7/31 Goodbye Christopher Robin
8/7 Paddington 2
8/14 The Greatest Showman
8/21 Ferdinand
8/28 Ghostbusters
Crossroads Park
8/2 TBD
8/9 TBD
8/16 TBD
8/23 TBD
Carillon Point Plaza
7/7 Despicable Me 3
7/21 The Wedding Singer
8/4 Jumanji
8/18 Star Wars: The Last Jedi
Marymoor Park
6/28 The Goonies
7/5 Wonder Woman
7/11 Jumanji
7/18 Coco
7/25 The Greatest Showman
8/2 10 Things I Hate About You
8/8 Thor: Ragnarok
8/15 Ferdinand
8/22 Black Panther
8/29 The Princess Bride
Seattle Area
Seattle Center Mural Amphitheatre
7/20 A League of Their Own
Columbia Park
7/14 Best of the Children’s International Film Festival
8/18 Coco
Shilshole Bay Marina
8/3 Overboard
8/17 Moana
Seattle Center Mural Amphitheatre
7/28 The Princess Bride
8/4 Get Out
8/11 Little Shop of Horrors
8/18 I am Not Your Negro
8/25 Wonder Woman
South Lake Union Discovery Center
6/16 The Goonies
7/21 Jurassic Park
8/25 Black Panther
Fauntleroy Triangle
7/21 Wonder Woman
7/28 The Secret Life of Pets
8/4 Star Wars: The Last Jedi
8/11 A Wrinkle in Time
8/18 Coco
8/25 Black Panther
*Check websites for start times, pre-movie activities and to make sure your favorite movie hasn’t been canceled or changed!
