The Fourth of July is right around the corner. With it being on a Wednesday, keeping it local makes sense. Here is a list of local firework shows to help you celebrate the great U.S. of A!
It is that time of year when the sun comes out and the kids need to cool down and get their wiggles out outside. My blog has a list of local splash parks that are sure to beat the summer heat!
The current break-even horizon* in the Seattle metro area is 1.6 years!
*The amount of time you need to own your home in order for owning to be a superior financial decision.
With rising rental rates, historically low interest rates, and home prices on the rise, the advantage of buying vs. renting is becoming clearer each month.
In fact, Seattle has seen some of the sharpest rent hikes in the country over the last year! Snohomish County has seen a huge increase in apartment growth and rising rental rates as well. There are several factors to consider that will lead you to make the best decision for your lifestyle and your financial bottom line. Zillow Research has determined the break-even point for renting vs. buying in our metro area. In other words, the amount of time you need to own your home in order for owning to be a superior financial decision. Currently in Seattle the break-even point is 1.6 years – that is quick! What is so great about every month that ticks away thereafter is that your nest egg is building in value.
I am happy to help you or someone you know assess your options; please contact me anytime.
These assumptions are based on a home buyer purchasing a home with a 30-year, fixed-rate mortgage and a 20 percent down payment; and a renter earning five percent annually on investments in the stock market.
It’s not too late! If you’re thinking about planting some fresh veggies but haven’t started yet, you still have time to get things in the ground for a late summer/early fall harvest. On average, the Puget Sound’s frost-free growing season is mid-March through mid-November, so with a little knowledge of when and how to start things, you can still see a bountiful harvest this year.
Some plants can be direct seeded into your garden, while others should be started indoors before being transplanted to your garden space. Deciding what to grow is the fun part! Plant what you like to eat, keeping in mind that some plants do better in our area than others.
Broccoli is arguably one of the most productive veggies you can grow in this area, although it can be vulnerable to root maggots and aphids. Giant Italian Parsley is easy to grow, highly productive, and expensive in the grocery store. Leeks are another that can be costly to buy in the store but trouble-free to grow in your own small space. Chard, Kale, Lettuce and Arugula are all full of vitamins and great for Northwest gardens. Carrots, Snap Peas, Snap Beans, Tomatoes and Basil all taste amazing fresh from the garden and grow relatively well in this area.
Check out the great resources at Garden.org for a full list of when to plant all these vegetables and more. They have detailed timelines for both spring and fall gardening; as well as information on transplanting seedlings vs. direct-sowing seeds.
Double-digit price appreciation has taken place for over 3 years now, so prices are up. Way up. In fact, in just the last year we have seen prices rise 14% year-over-year. When talking with people about our real estate market, the conversation often involves the question, “are we headed toward a bubble?” I get asked this question often, and I can understand why. With the Great Recession not too far back in our rear-view mirror, the fear that surrounds the bottom dropping out in our home values is real. The large price gains might seem familiar to the gains of the previous up market of 2004-2007, but the environment is much different, and that is why we are not headed toward a housing collapse.
Lending Requirements & Down Payments
Previous lending practices allowed people to get into homes with high debt-to-income ratios, low credit scores, risky loan programs, and undocumented incomes. They called this sub-prime lending. This led to the housing bubble bursting 10 years ago – because people received mortgages they were not equipped to handle. Borrowers were not properly qualified for their monthly payments, and with minimal down payments they had no skin in the game. There were also a ton of adjustable rate mortgages and interest-only loans, which created negative equity positions. In July 2007, the sub-prime loan products disappeared and literally became history overnight. This eliminated a large part of the buyer pool creating over supply, not to mention the foreclosures that followed due to these ill-equipped homeowners walking away. The combination of these two factors caused prices to plummet.
Conversely, in March of this year, the average credit score for an approved conventional loan according to Ellie Mae was 752. Banks are scrutinizing their borrowers much more thoroughly than in the past. Credit scores are only the start; solid documentation of employment, assets, and debt are all passed through strict underwriting standards before closing. During the days of sub-prime lending, banks were funding loans with scores as low as 560! This, coupled with many zero-down loan programs and the risky terms mentioned above, left many new homeowners with little to no equity. When you have little or no equity it is very easy to bail.
In addition to heartier credit scores, down payments have increased significantly. According to Attom Data Solutions the average down payment is 18%. To put this in perspective, the median price in Seattle Metro in the first quarter of 2018 was $775,000. 18% of that is $139,500! There is a marked difference in the connection to one’s investment with such a large amount on the line versus the common 0% down loans of the sub-prime era. When people have high equity levels they are not likely to abandon their home or miss payments.
Our Thriving Local Economy, Job Creation & Californians
According to Matthew Gardner, Windermere’s Chief Economist, it is forecasted that there will be 46,000 more jobs in the Seattle Metro area in 2018. This has created high numbers of residual migration into our area from other states. In 2016 there were 50,000 people that moved here, and 47,000 in 2017. Many of these new Washingtonians are former Californians, specifically from the Bay Area. Unbelievably, our prices are attractive to this group, as they can take a similar tech job here and make the same income with a lower cost of living. If untethered and up for a move, it’s a no-brainer.
The most influential factor that has led the run on prices has been low inventory levels coupled with high housing demand. It’s simply the concept of supply and demand. The growth of companies like Amazon, Google, and Facebook in our area has created increased demand, especially for homes closer to job centers resulting in shorter commutes. When you have increased demand and not enough homes to absorb the buyers, prices go up. Over the last three years we have easily seen a 10%+ increase in prices year-over-year. That is above the norm, and will slow down once inventory increases. That slowdown will be welcomed and it will not be a collapse in values or a bubble bursting.
Interest Rates
Interest rates are increasing, and it is predicted they will reach close to 4.95% by the end of the year. This will naturally curtail price growth because it will not be as cheap to borrow money, which will cause buyers to temper their pricing ceilings. Bear in mind, that an interest rate of 4.95% is still historically low, we’ve just been incredibly fortunate to be able to secure long term loans with minimal debt service. The average interest rate over the last 30 years is 7%.
I understand that the recent increase in home prices has been big and that it might remind you of the previous up market before the crash. I hope that digging into the topics above has shed some light on how it is different. I always welcome the opportunity to have a conversation about these hot topics and discern how they relate to you. As always, it is my goal to help keep my clients informed and empower strong decisions. Please let me know if I can answer any questions or help you or anyone you know with their real estate needs.
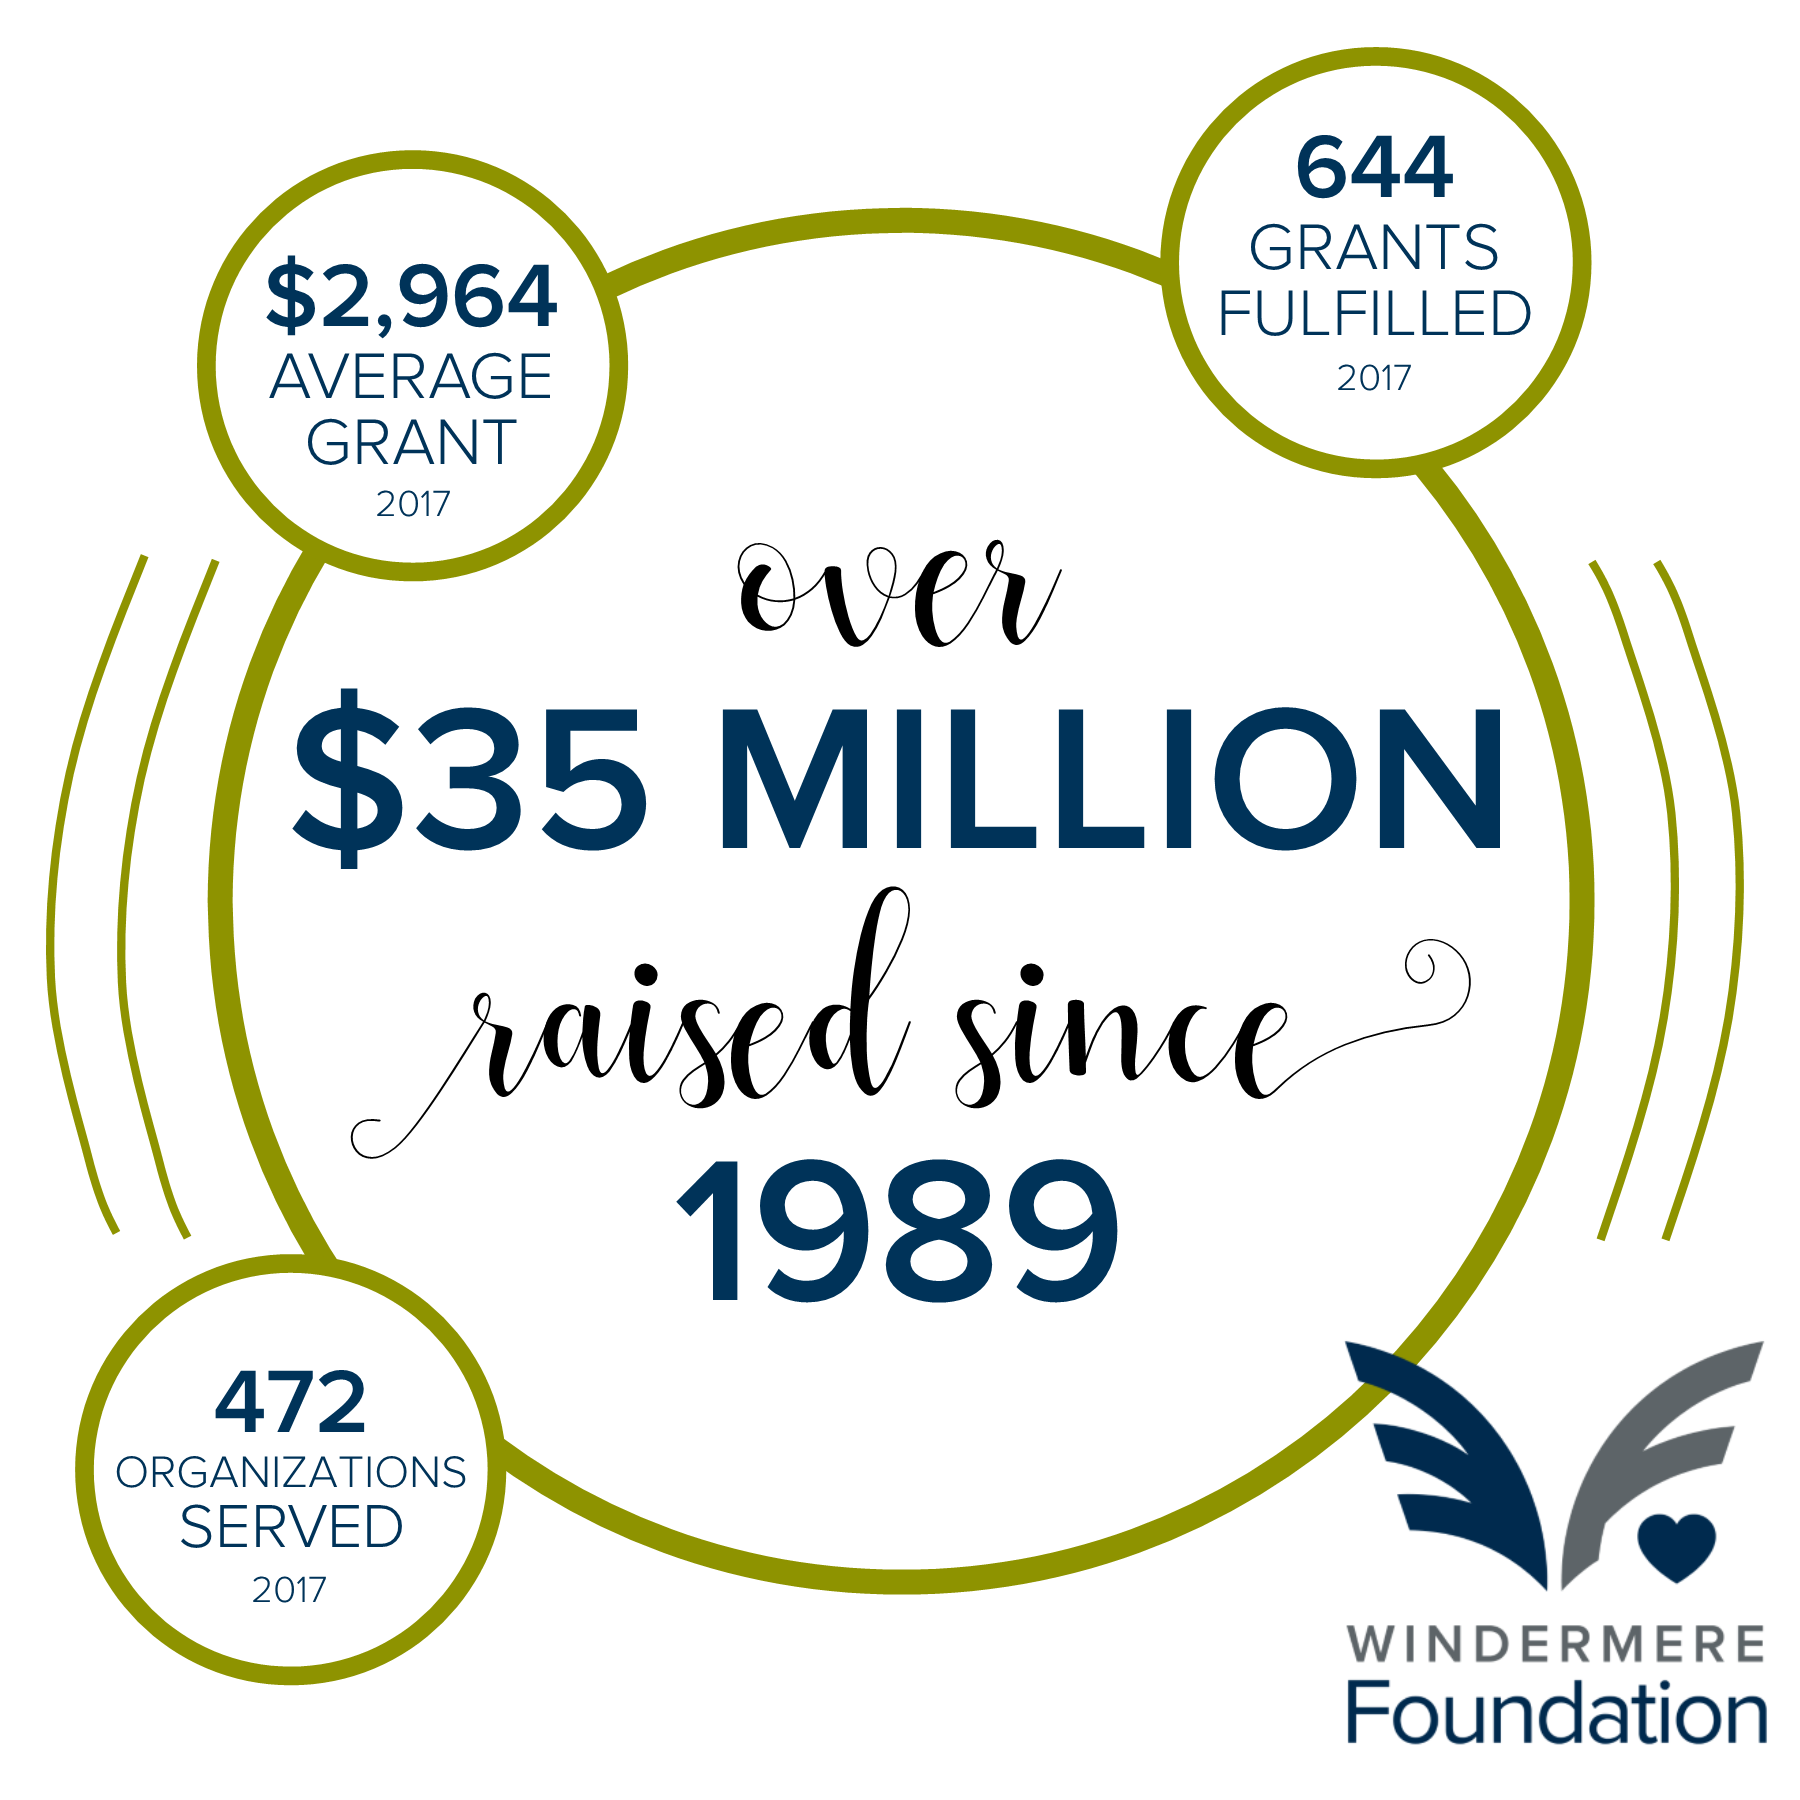
Thanks to your continued support, the Windermere Foundation collected over $330,000 in donations in the first quarter of 2018. Fifty-eight percent of the donations came from individual contributions and fundraisers, while 42 percent came from donations through Windermere agent sales transactions. This brings our grand total to $35,869,961 raised since 1989. We are very close to reaching the $36-million mark! These funds go towards supporting low-income and homeless families right here in our local community.
Thanks again for all you do to support the Windermere Foundation. Together, we are able to make a difference for those in need in our local communities.
For the full first quarter 2018 report, please visit the Windermere blog, and to learn more about the Windermere Foundation, visit www.windermere.com/foundation.
Now that the 20 17 tax deadline has come and gone it is time to think about how the new tax reform of 2018 might affect you next year. A few notable items are the limited mortgage interest rate deduction capped at $750,000, limited property tax deduction capped at $10,000 and moving expenses can only be written off by members of the armed services. Read the full article here and take notes, so you are prepared for next year’s tax season.
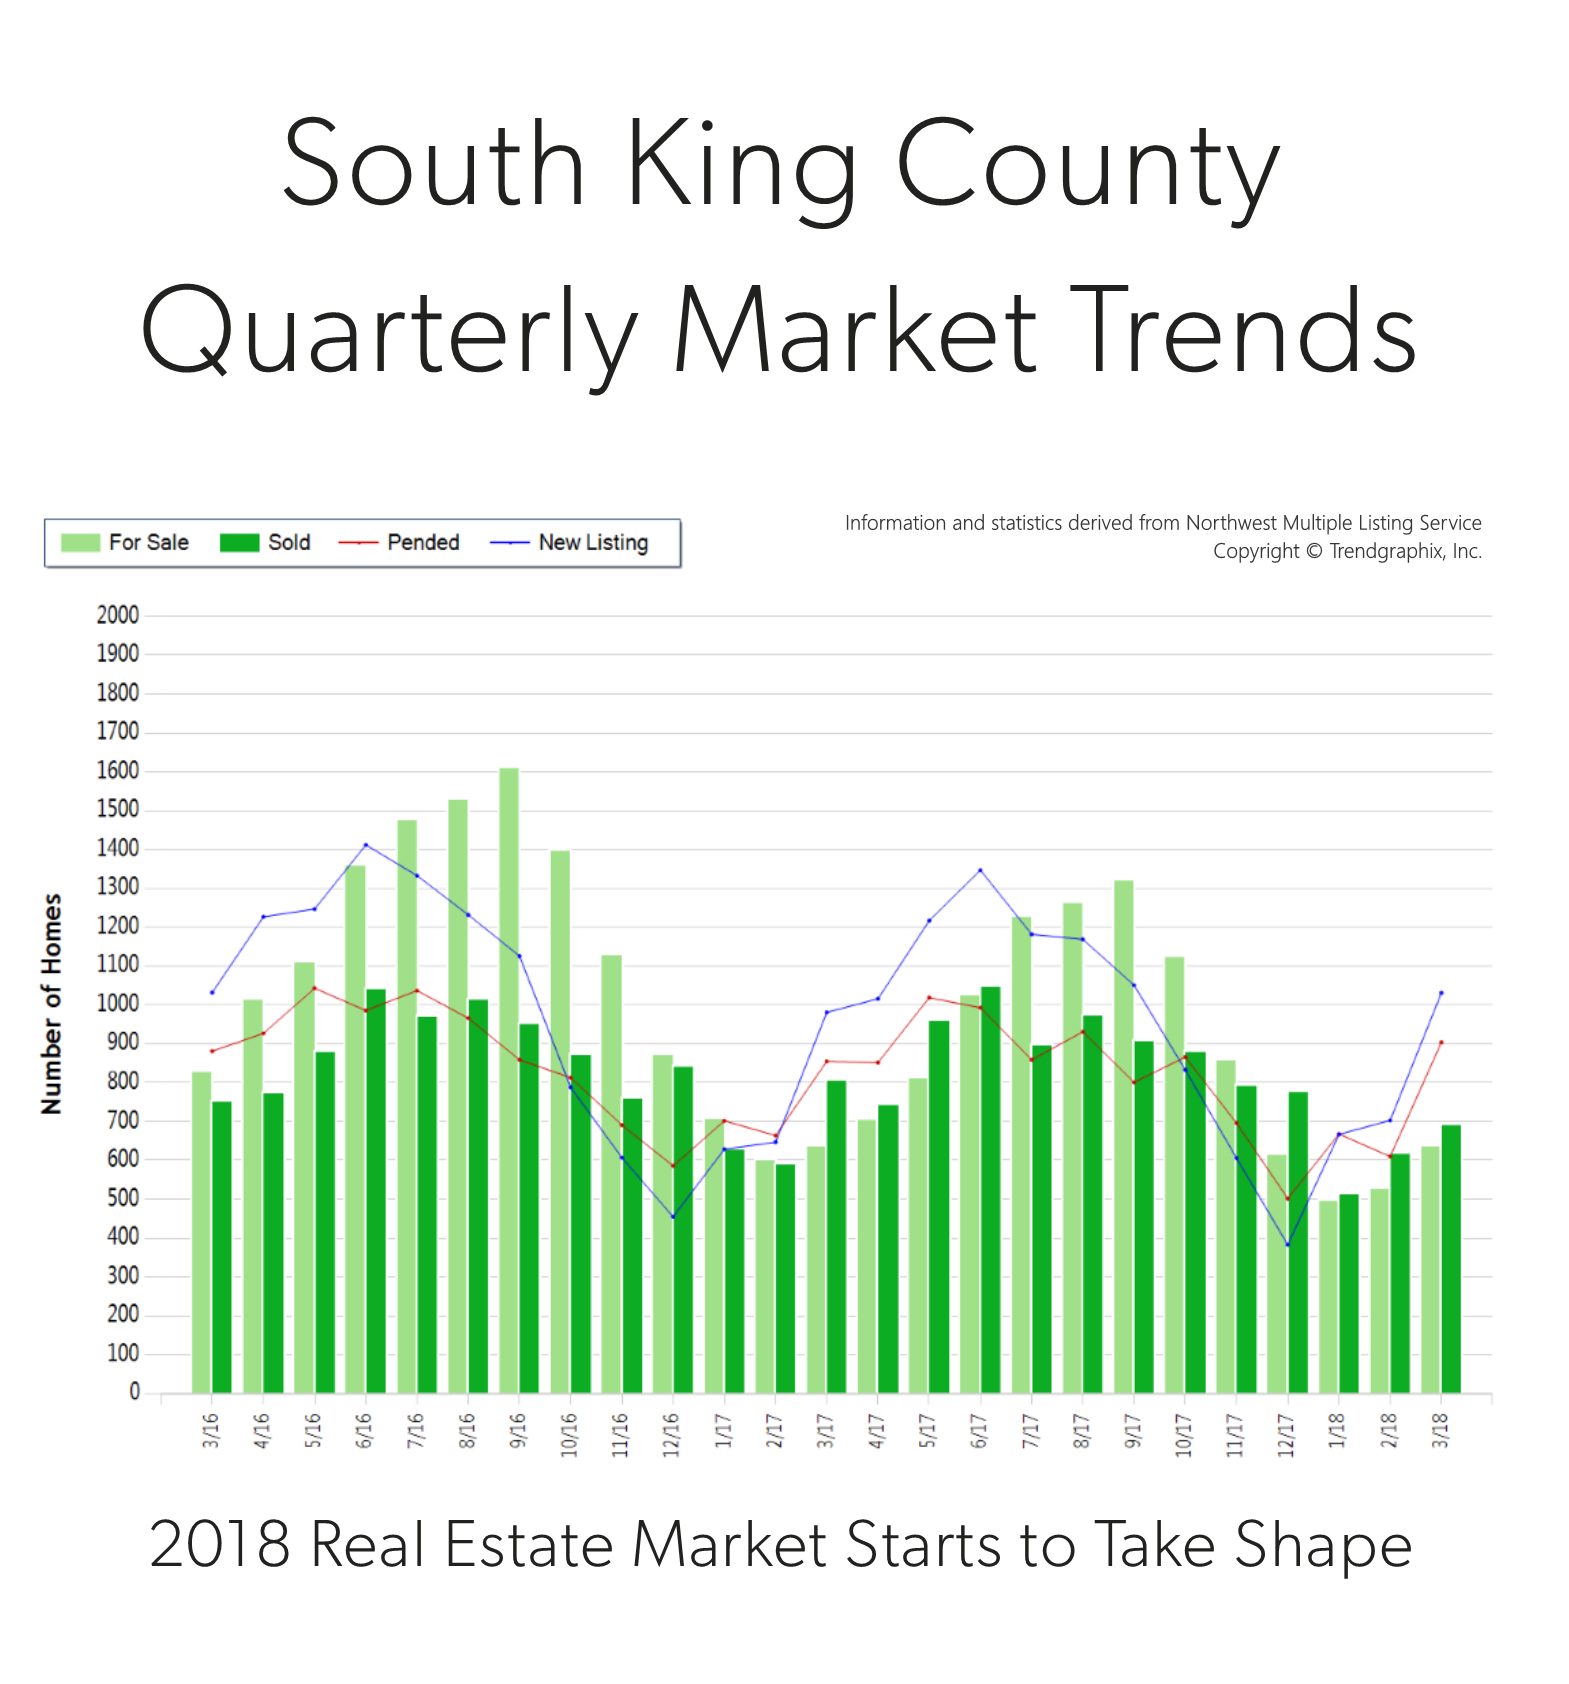
It is the time of year when our market starts to take off. Spring is here and we are starting to see seasonal increases in inventory. In fact, there was a 47% increase in new listings in March compared to February. That increase was matched by a 48% rise in pending sales, illustrating very strong demand for housing in your area. Last month, the average list-to-sale price ratio (the amount the sale price topped the list price) was 101%, indicating that multiple offers were the norm. We ended the quarter with 0.7 months of inventory – the lowest level yet. More inventory would be absorbed by happy buyers looking for more selection and would help temper price growth, which is up 12% year-over-year.
South King County real estate has been a hot spot due to reasonable commute times and overall affordability compared to “in-city” real estate. In fact, the median price in March was 78% higher in Seattle Metro. Sellers are enjoying amazing returns due to this phenomenon, and buyers are securing mortgages with minor debt service due to low interest rates. This is a very strong seller’s market, but buyers who are securing a home are already enjoying appreciation in equity.
This is only a snapshot of the trends in south King County; please contact me if you would like further explanation of how the latest trends relate to you.
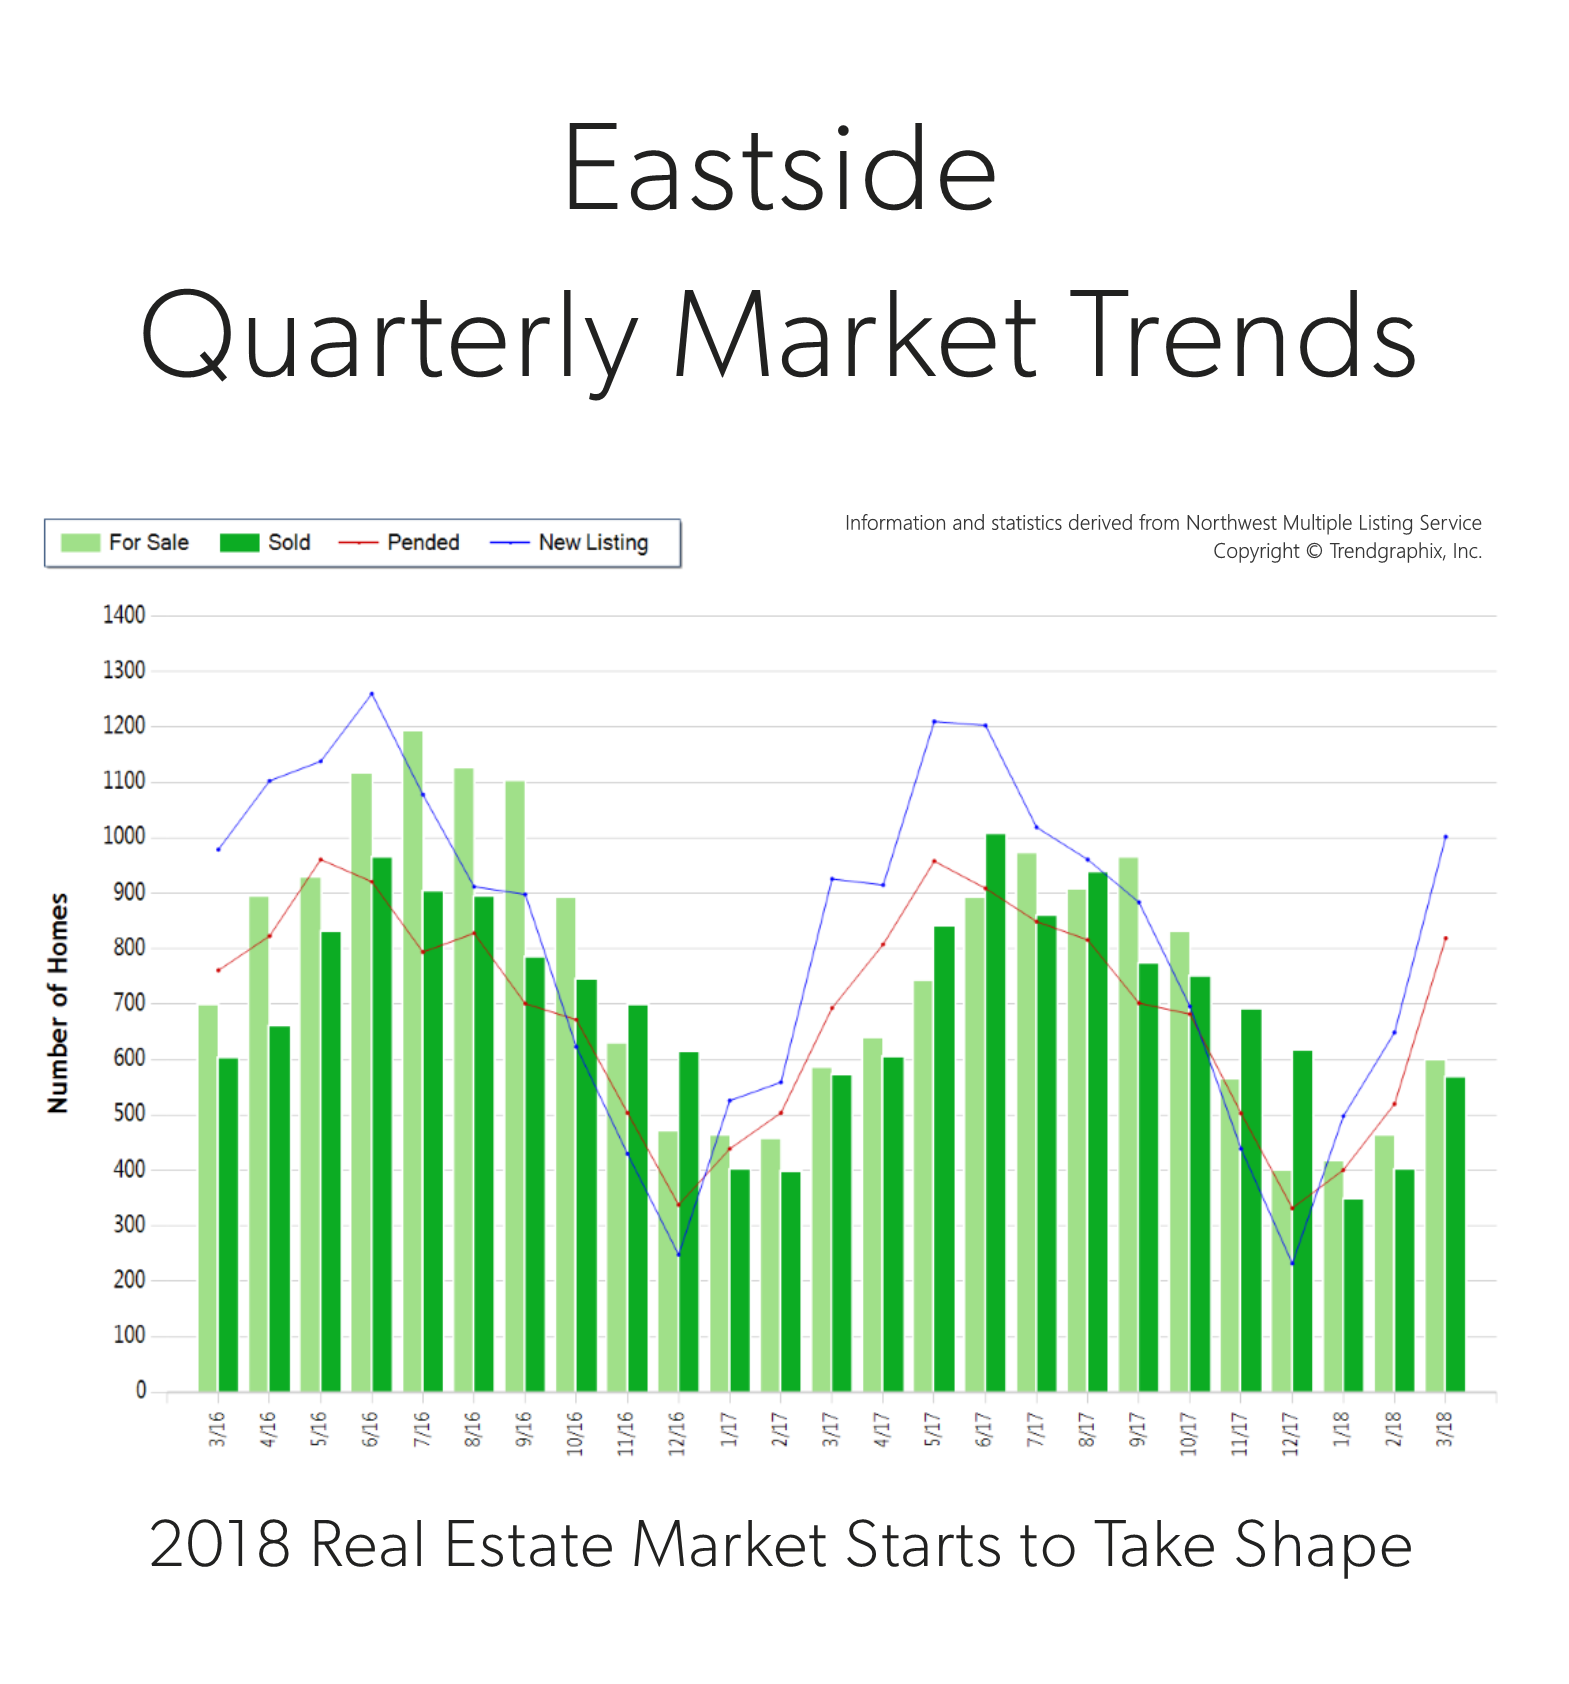
It is the time of year when our market starts to take off. Spring is here and we are starting to see seasonal increases in inventory. In fact, there was a 54% increase in new listings in March compared to February. That increase was topped by a 58% rise in pending sales, illustrating very strong demand for housing in your area. Last month, the average list-to-sale price ratio (the amount the sale price topped the list price) was 103%, indicating that multiple offers were the norm. We ended the quarter with 0.7 months of inventory – the lowest level yet. More inventory would be absorbed by happy buyers looking for more selection and would help temper price growth, which is up 14% year-over-year.
Eastside real estate has a very high premium due to close-in commute times and desirable neighborhoods. In fact, the median price in March was $927,000! Sellers are enjoying amazing returns due to this phenomenon, and buyers are securing mortgages with minor debt service due to low interest rates. This is a very strong seller’s market, but buyers who are securing a home are already enjoying appreciation in equity.
This is only a snapshot of the trends on the Eastside area; please contact me if you would like further explanation of how the latest trends relate to you.
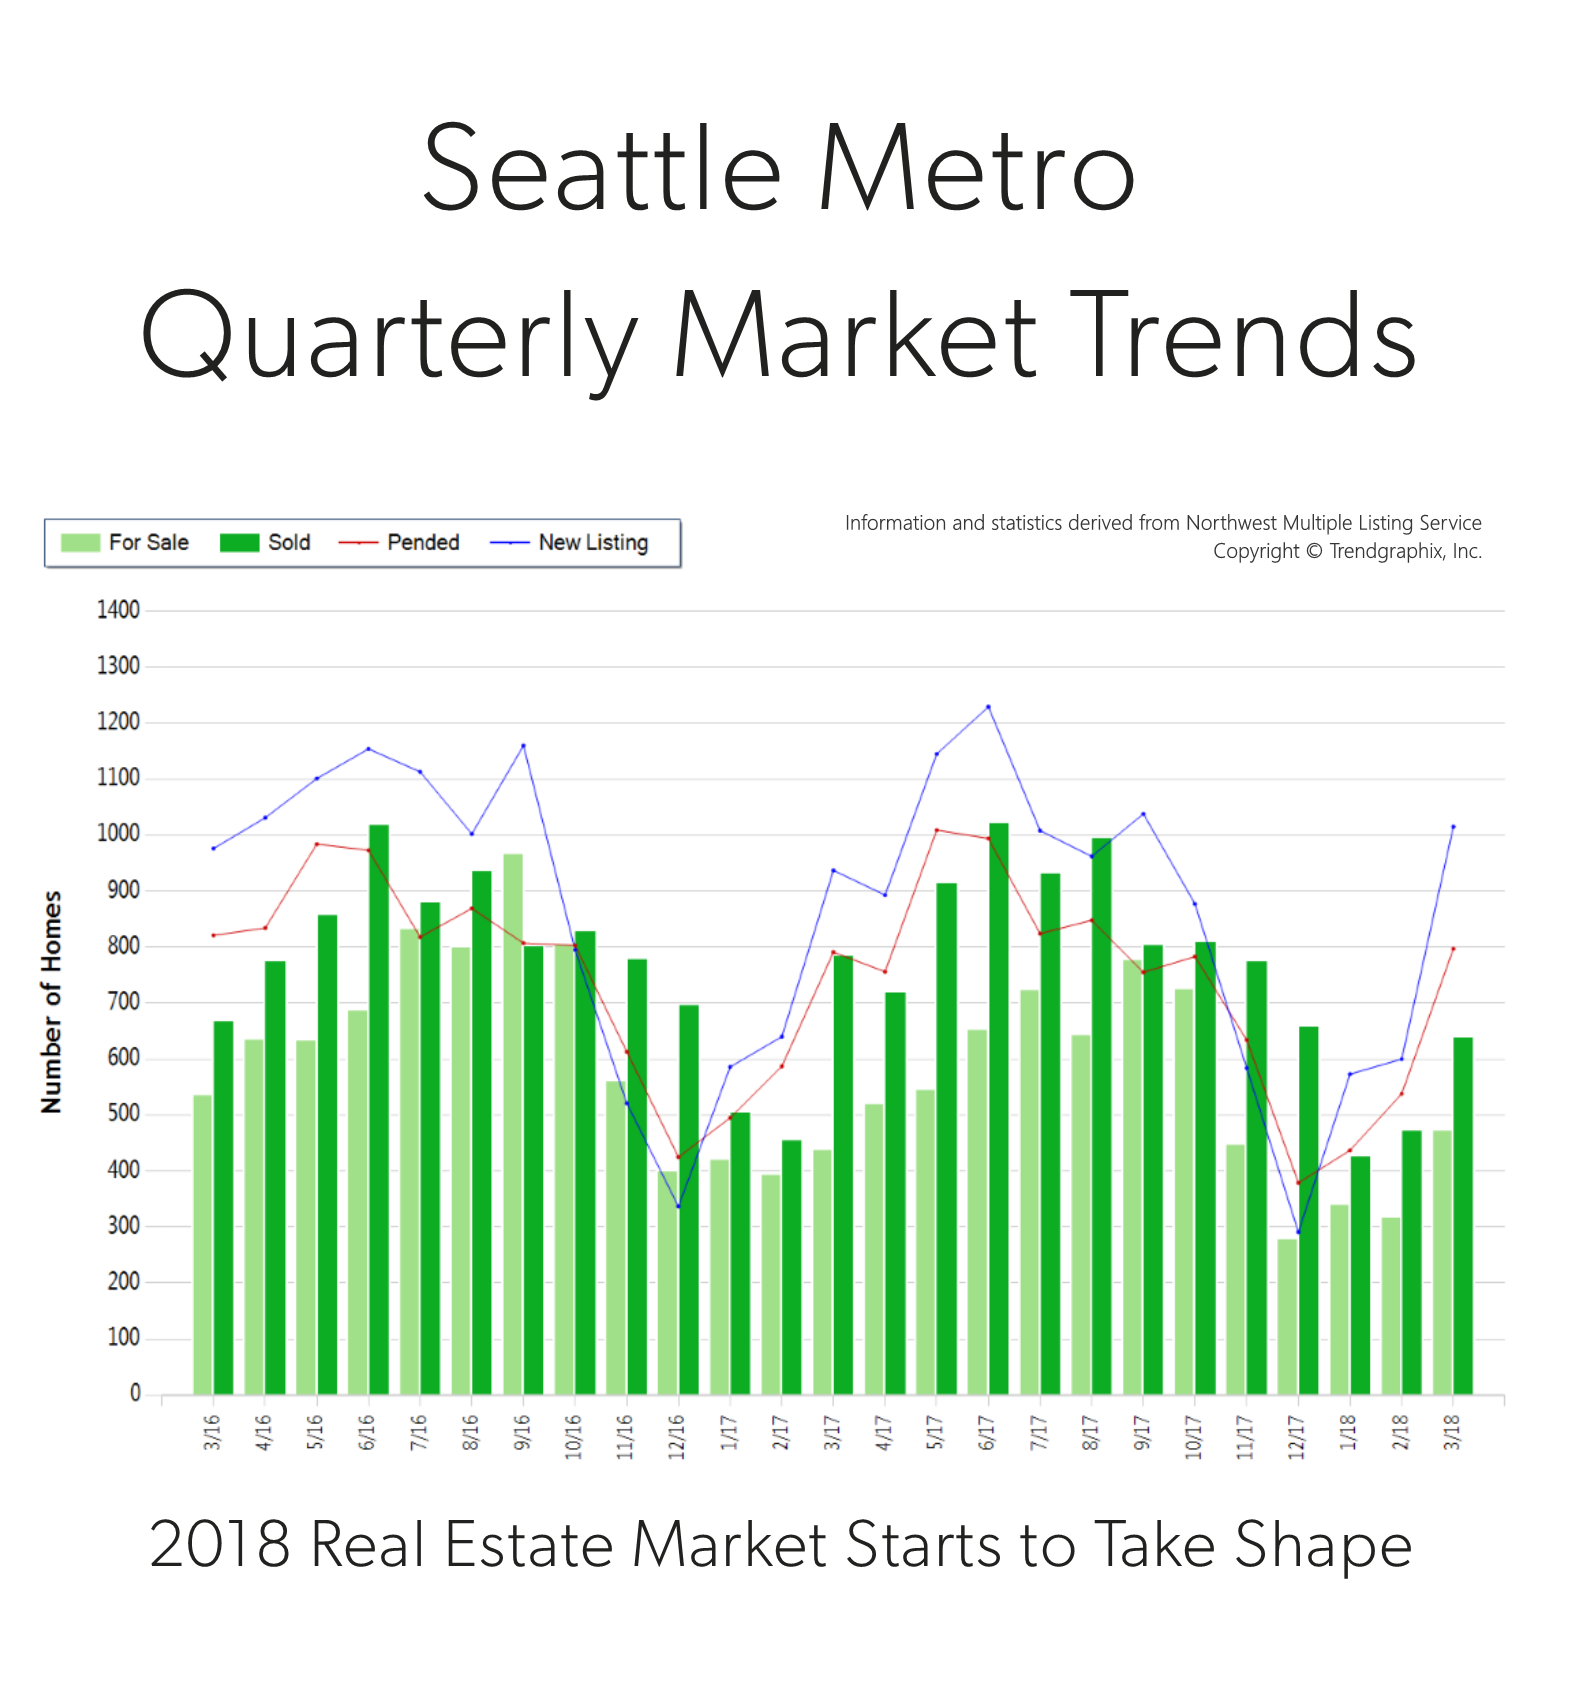
It is the time of year when our market starts to take off. Spring is here and we are starting to see seasonal increases in inventory. In fact, there was a 69% increase in new listings in March compared to February. That increase was followed by a 48% rise in pending sales, illustrating very strong demand for housing in your area. Last month, the average list-to-sale price ratio (the amount the sale price topped the list price) was 105%, indicating that multiple offers were the norm. We ended the quarter with 0.6 months of inventory based on pending sales. More inventory would be absorbed by happy buyers looking for more selection and would help temper price growth, which is up 16% year-over-year.
Seattle Metro real estate has a very high premium due to close-in commute times and vibrant neighborhoods. In fact, the median price in March was $800,000, up 5% from the month prior! Sellers are enjoying amazing returns due to this phenomenon, and buyers are securing mortgages with minor debt service due to low interest rates. This is a very strong seller’s market, but buyers who are securing a home are already enjoying appreciation in equity.
This is only a snapshot of the trends in the Seattle Metro area; please contact me if you would like further explanation of how the latest trends relate to you.

 Facebook
 X
X
 Pinterest
 Copy Link