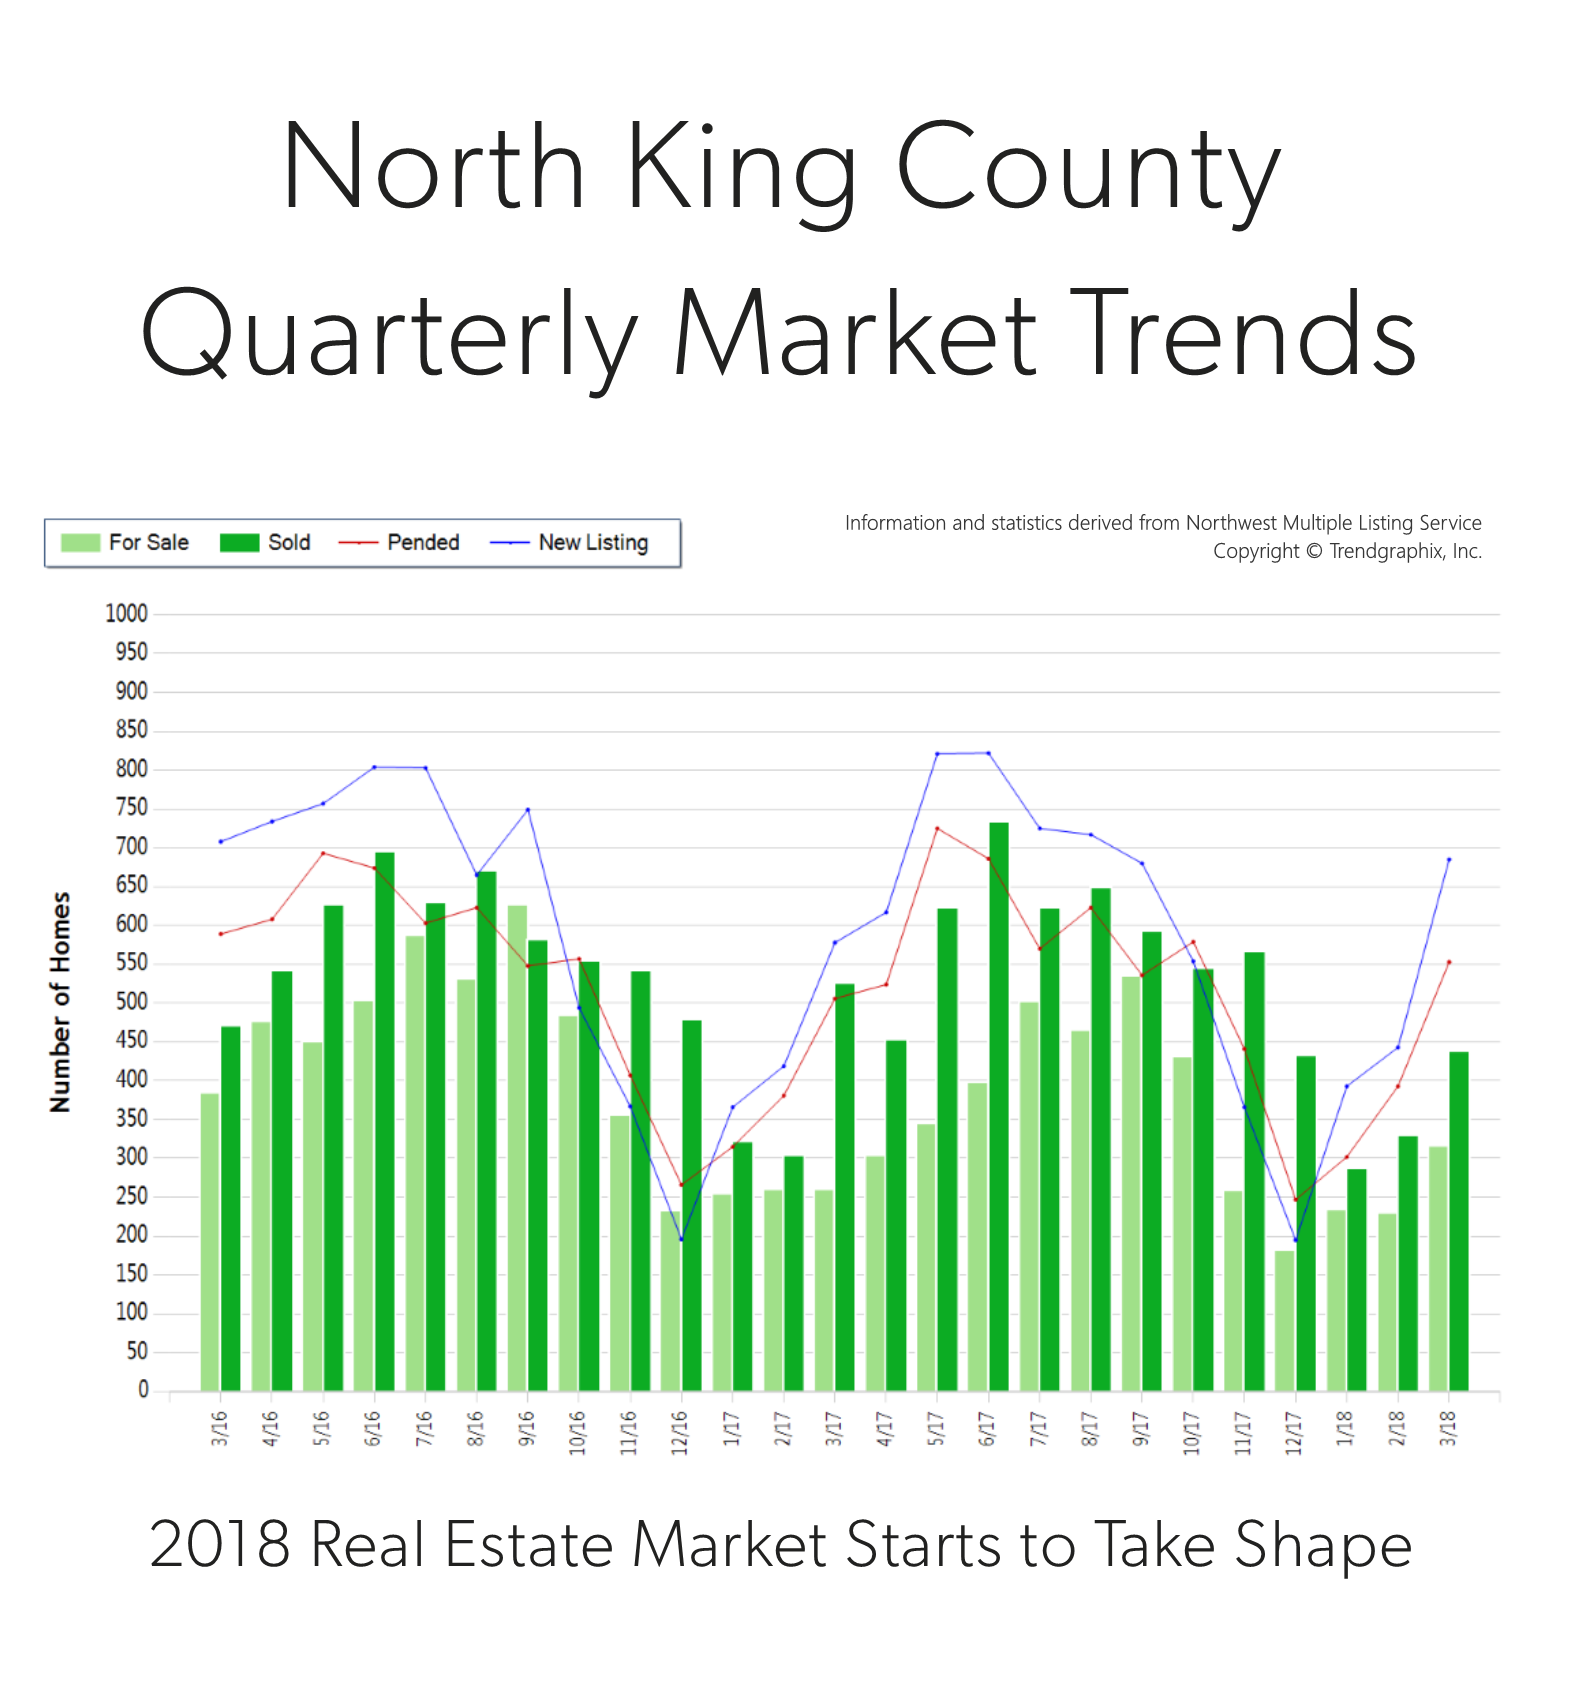
It is the time of year when our market starts to take off. Spring is here and we are starting to see seasonal increases in inventory. In fact, there was a 55% increase in new listings in March compared to February. That increase was followed by a 41% rise in pending sales, illustrating very strong demand for housing in your area. Last month, the average list-to-sale price ratio (the amount the sale price topped the list price) was 106%, indicating that multiple offers were the norm. We ended the quarter with 0.6 months of inventory based on pending sales. More inventory would be absorbed by happy buyers looking for more selection and would help temper price growth, which is up 14% year-over-year.
North King County real estate has a very high premium due to close-in commute times and desirable neighborhoods. In fact, the median price in March was $808,000, up 4% from the month prior! Sellers are enjoying amazing returns due to this phenomenon, and buyers are securing mortgages with minor debt service due to low interest rates. This is a very strong seller’s market, but buyers who are securing a home are already enjoying appreciation in equity.
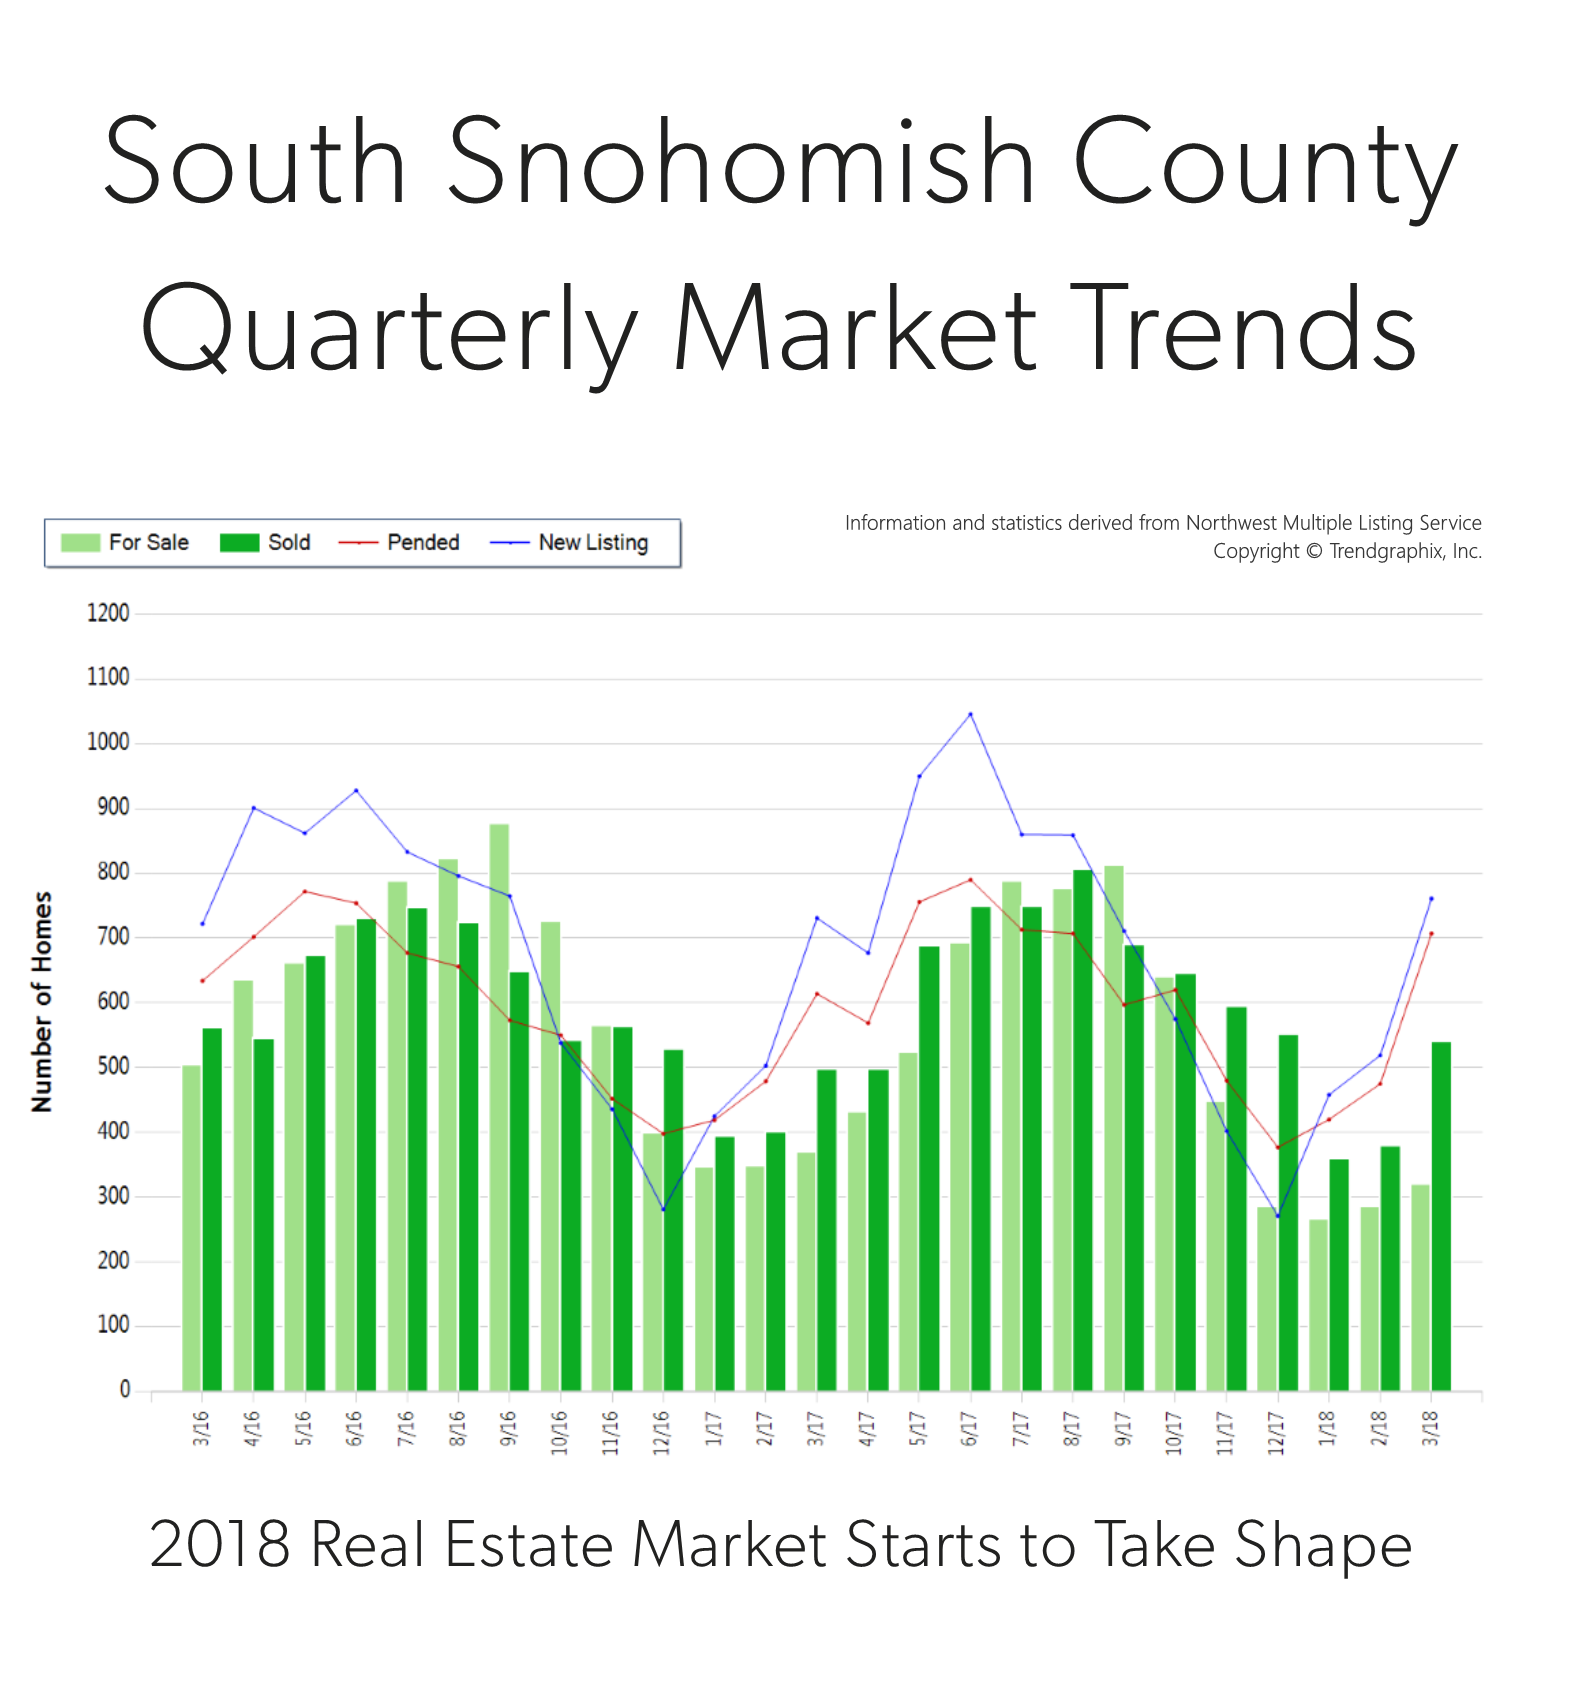
It is the time of year when our market starts to take off. Spring is here and we are starting to see seasonal increases in inventory. In fact, there was a 47% increase in new listings in March compared to February. That increase was matched by a 48% rise in pending sales, illustrating very strong demand for housing in your area. Last month, the average list-to-sale price ratio (the amount the sale price topped the list price) was 103%, indicating that multiple offers were the norm. We ended the quarter with 0.5 months of inventory – the lowest level yet. More inventory would be absorbed by happy buyers looking for more selection and would help temper price growth, which is up 15% year-over-year.
South Snohomish County real estate has been a hot spot due to reasonable commute times and overall affordability compared to “in-city” real estate. In fact, the median price in March was 47% higher in Seattle Metro. Sellers are enjoying amazing returns due to this phenomenon, and buyers are securing mortgages with minor debt service due to low interest rates. This is a very strong seller’s market, but buyers who are securing a home are already enjoying appreciation in equity.
This is only a snapshot of the trends in south Snohomish County; please contact me if you would like further explanation of how the latest trends relate to you.
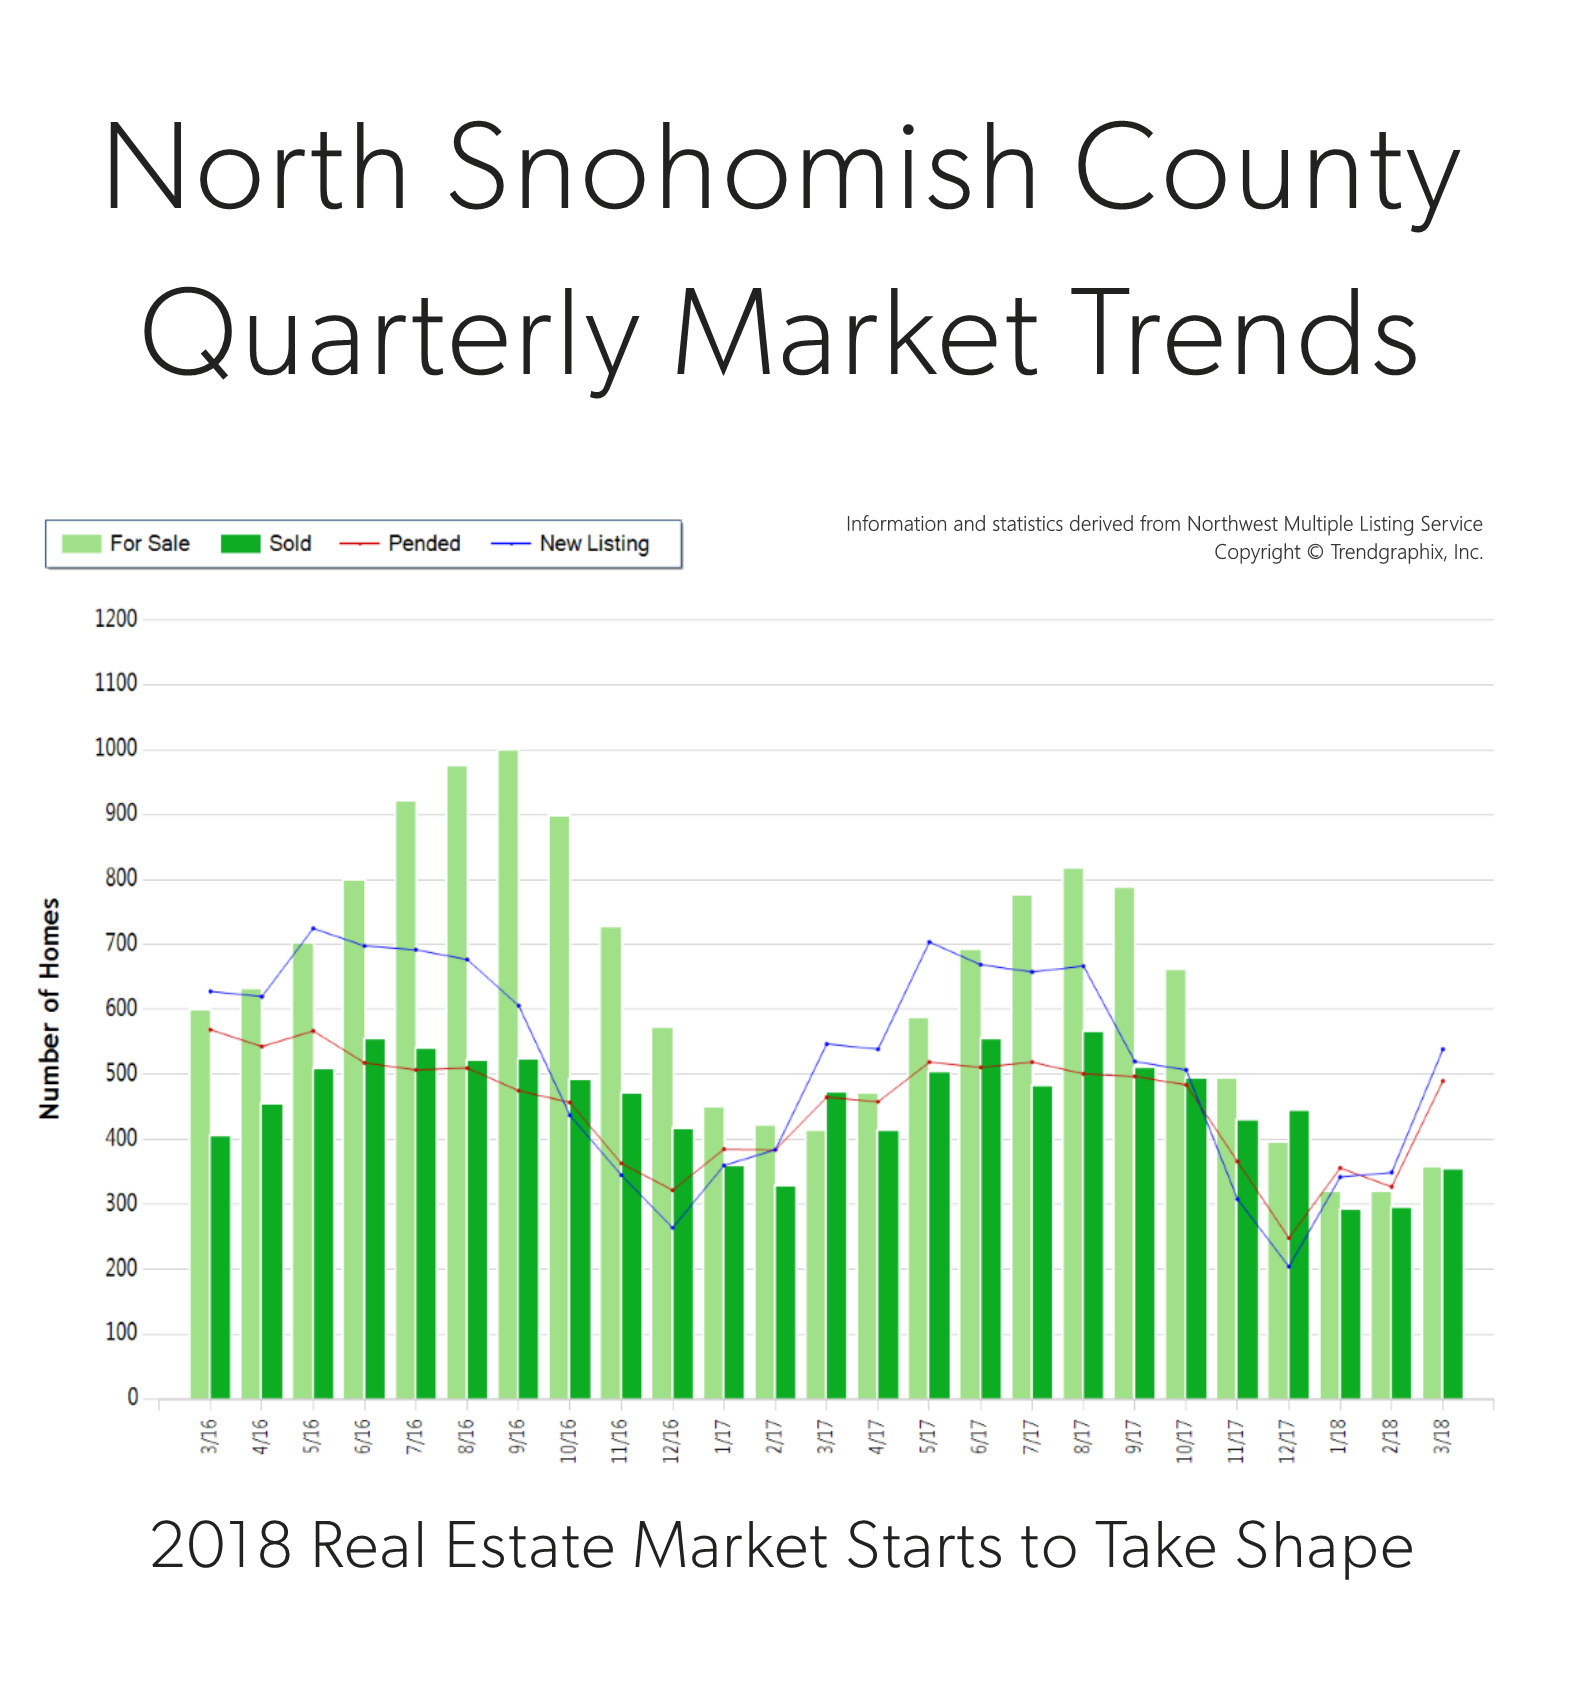
It is the time of year when our market starts to take off. Spring is here and we are starting to see seasonal increases in inventory. In fact, there was a 54% increase in new listings in March compared to February. That increase was matched by a 50% rise in pending sales, illustrating very strong demand for housing in your area. Last month, the average list-to-sale price ratio was 100%, and average days on market was 35 days. We ended the quarter with 0.7 months of inventory – the lowest level yet. More inventory would be absorbed by happy buyers looking for more selection and would help temper price growth, which is up 12% year-over-year.
North Snohomish County is one of the most affordable markets in the area. In fact, the median price in March was 28% higher in south Snohomish County. Buyers are migrating to the area, especially if they don’t have to commute into the city. Sellers are enjoying amazing returns due to this phenomenon, and buyers are securing mortgages with minor debt service due to low interest rates. This is a very strong seller’s market, but buyers who are securing a home are already enjoying appreciation in equity.
This is only a snapshot of the trends in north Snohomish County; please contact me if you would like further explanation of how the latest trends relate to you.
I am commonly asked which improvements sellers should make to get the greatest return on their home sale. Every year The Remodeling 2018 Cost vs. Value Report (www.costvsvalue.com) compiles all the information and analyzes the estimated percentage return on home improvements in each region. Getting a home prepared for market requires a keen eye and great resources. To access the entire Cost vs. Value report please visit www.costvsvalue.com and follow the steps to locate the Seattle area report.
Also, I have a great list of reputable contractors from HVAC to plumbing to roofing who are licensed and bonded in the State of Washington. Please call on me whenever you need a solid recommendation. I am happy to help whether you are getting your home ready for market or just want to find a good window washer now that the sun is starting to shine a little more.
Complete data from the Remodeling 2018 Cost vs. Value Report can be downloaded free at www.costvsvalue.com
The Windermere Foundation had another banner year in 2017, raising even more than it did the prior year thanks to the continued support of Windermere franchise owners, agents, staff, and the community. Over $2.4 million was raised in 2017, which is an increase of eight percent over the previous year. This brings our total to over $35.5 million raised since the start of the Windermere Foundation in 1989.
A portion of the money raised last year is thanks to our agents who each make a donation to the Windermere Foundation from every commission they earn. Additional donations from Windermere agents, the community, and fundraisers made up 66% of the money collected in 2017. These funds enable our offices to support local non-profits that provide much-needed services to low-income and homeless families in their communities.
SUMMARY OF FUNDS, GRANTS & DONATIONS IN 2017
*Organizations served: 472
*Number of individual grants fulfilled: 644
*Average grant amount: $2,964.04
*Average donation to the Windermere Foundation: $116.08
So how are Windermere Foundation funds used? Windermere offices decide for themselves how to distribute the money in their local community. Our offices have helped support school lunch and afterschool programs, housing assistance for homeless families, food banks, homeless shelters, and non-profits that provide basic necessities, such as shoes, clothing, toiletries, and blankets to families in need.
A very notable day in 2017 for the Windermere Foundation was November 15, when a record-breaking $253,782 was given in a single day. A total of 35 non-profit organizations benefitted from that day’s donations, including Attain Housing in Kirkland, WA, which received $56,000 from the Windermere Real Estate East, Inc. group of offices. Other organizations that received donations were Boys and Girls Club of Contra Costa in Walnut Creek, CA, and the Shady Cove School in Shady Cove, Oregon.
2017 also marked the second year of our #tacklehomelessness campaign with the Seattle Seahawks, in which Windermere committed to donating $100 for every Seahawks home game defensive tackle to YouthCare, a non-profit organization that provides critical services to homeless youth. While the Seahawks didn’t make it to the playoffs this year, they did help us raise $31,800. When added to last year’s $35,000, that’s a total donation of $66,800. We are grateful for the opportunity to provide additional support to homeless youth thanks to the Seahawks, YouthCare, and the #tacklehomelessness campaign.
Thanks to our agents, offices, and everyone who supports the Windermere Foundation, we are able to continue to make a difference in the lives of many families in our local communities. If you’d like to help support programs in your community, please click the Donate button.
To learn more about the Windermere Foundation, visit http://www.windermere.com/foundation.
The Washington State economy added 104,600 new jobs over the past 12 months. This impressive growth rate of 3.1% is well above the national rate of 1.4%. Interestingly, the slowdown we saw through most of the second half of the year reversed in the fall, and we actually saw more robust employment growth.
Growth continues to be broad-based, with expansion in all major job sectors other than aerospace due to a slowdown at Boeing.
With job creation, the state unemployment rate stands at 4.5%, essentially indicating that the state is close to full employment. Additionally, all counties contained within this report show unemployment rates below where they were a year ago.
I expect continued economic expansion in Washington State in 2018; however, we are likely to see a modest slowdown, which is to be expected at this stage in the business cycle.
HOME SALES ACTIVITY
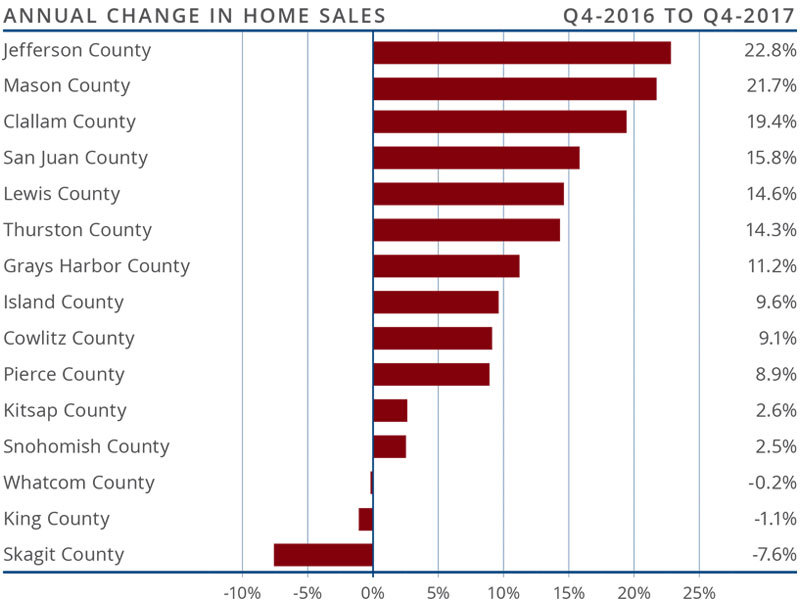
There were 22,325 home sales during the final quarter of 2017. This is an increase of 3.7% over the same period in 2016.
Jefferson County saw sales rise the fastest relative to fourth quarter of 2016, with an impressive increase of 22.8%. Six other counties saw double-digit gains in sales. A lack of listings impacted King and Skagit Counties, where sales fell.
Housing inventory was down by 16.2% when compared to the fourth quarter of 2016, and down by 17.3% from last quarter. This isn’t terribly surprising since we typically see a slowdown as we enter the winter months. Pending home sales rose by 4.1% over the third quarter of 2017, suggesting that closings in the first quarter of 2018 should be robust.
The takeaway from this data is that listings remain at very low levels and, unfortunately, I don’t expect to see substantial increases in 2018. The region is likely to remain somewhat starved for inventory for the foreseeable future.
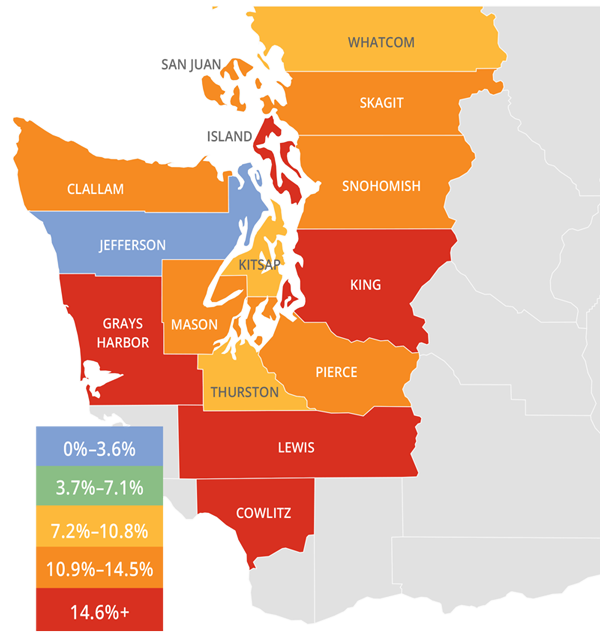
HOME PRICES
Because of low inventory in the fall of 2017, price growth was well above long-term averages across Western Washington. Year-over-year, average prices rose 12% to $466,726.
Economic vitality in the region is leading to a demand for housing that far exceeds supply. Given the relative lack of newly constructed homes—something that is unlikely to change any time soon—there will continue to be pressure on the resale market. This means home prices will rise at above-average rates in 2018.
Compared to the same period a year ago, price growth was most pronounced in Lewis County, where home prices were 18.8% higher than a year ago. Eleven additional counties experienced double-digit price growth as well.
Mortgage rates in the fourth quarter rose very modestly, but remained below the four percent barrier. Although I anticipate rates will rise in 2018, the pace will be modest. My current forecast predicts an average 30-year rate of 4.4% in 2018—still remarkably low when compared to historic averages.
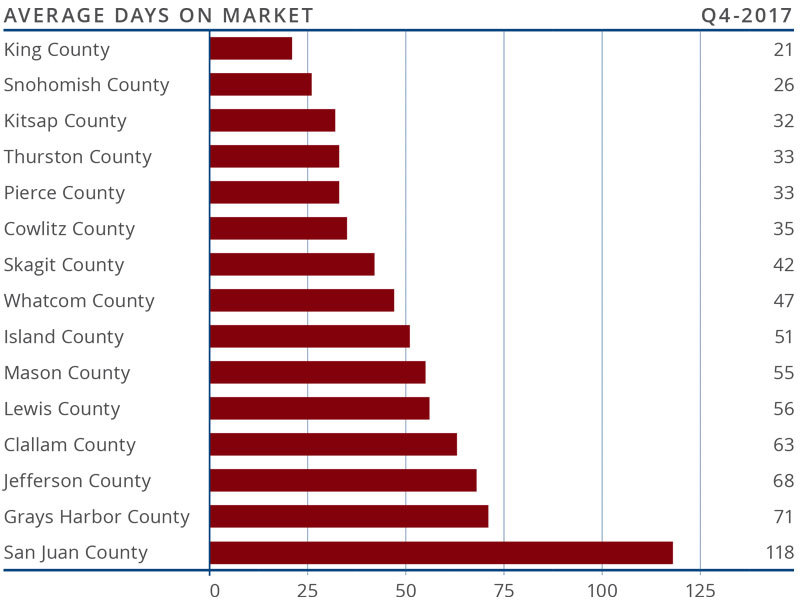
DAYS ON MARKET
The average number of days it took to sell a home in the fourth quarter dropped by eight days, compared to the same quarter of 2016.
King County continues to be the tightest market in Western Washington, with homes taking an average of 21 days to sell. Every county in the region saw the length of time it took to sell a home either drop or remain static relative to the same period a year ago.
Last quarter, it took an average of 50 days to sell a home. This is down from 58 days in the fourth quarter of 2016, but up by 7 days from the third quarter of 2017.
As mentioned earlier in this report, I expect inventory levels to rise modestly, which should lead to an increase in the average time it takes to sell a house. That said, with homes selling in less than two months on average, the market is nowhere near balanced.
CONCLUSIONS
This speedometer reflects the state of the region’s housing market using housing inventory, price gains, home sales, interest rates, and larger economic factors. For the fourth quarter of 2017, I have left the needle at the same point as third quarter. Price growth remains robust even as sales activity slowed. 2018 is setting itself up to be another very good year for housing.
Matthew Gardner is the Chief Economist for Windermere Real Estate, specializing in residential market analysis, commercial/industrial market analysis, financial analysis, and land use and regional economics. He is the former Principal of Gardner Economics, and has more than 30 years of professional experience both in the U.S. and U.K.

 Facebook
 X
X
 Pinterest
 Copy Link